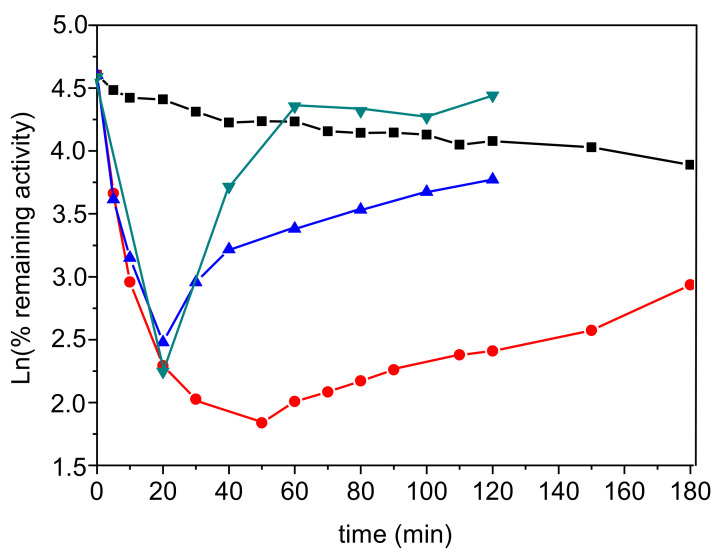
Figure 6.
SBI and subsequent acylation of 2 × 10⁻⁹ M AChE by 2 × 10⁻⁸ M TFK, followed by slow deacylation. Activity was assayed with 1 mM ATC with DTNB as the thiol probe (black, blue, red curves) and with Probe IV as the thiol probe (green curve). The black curve is enzyme activity (control) in the presence of 2% acetonitrile; the red curve is enzyme activity monitored up to 180 min in the presence of 2 × 10⁻⁸ M TFK. Blue curve: after steady-state SBI, the system was diluted 10 times, so that TFK dropped to 2 × 10⁻⁹ M after t = 20 min. Green curve: after steady-state SBI, the system was diluted 1000 times, then TFK final concentration dropped to 2 × 10⁻¹¹ M after t = 20 min. The first-order rate constant of deacylation (kreac) was estimated from the slope of Ln increase in activity vs. time.

