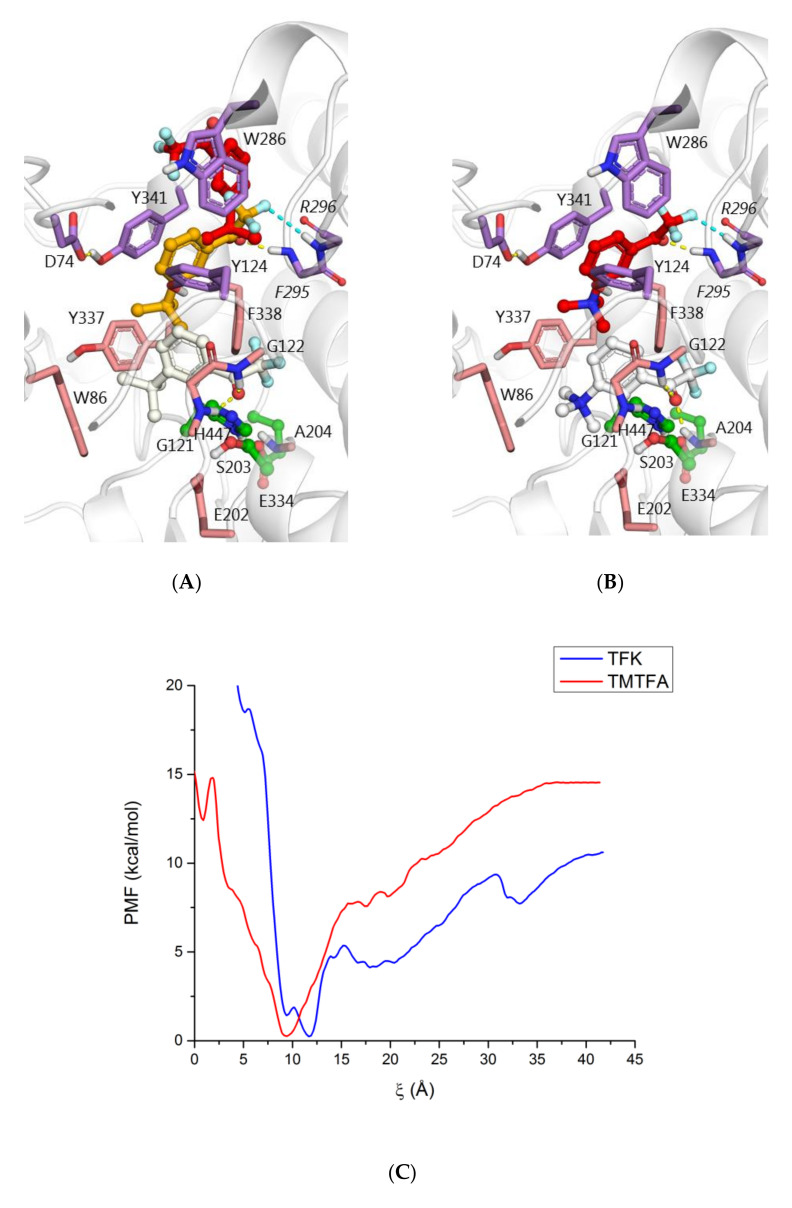
Figure 7.
Binding of TFK to AChE: (A) main docked poses in the gorge: in the PAS (most populated cluster, carbon atoms colored red), at the gorge rim partly blocking the bottleneck (carbon atoms orange), and in the active site ready to react with the catalytic serine (least populated cluster, carbon atoms are colored white) compared to the main binding poses of TMTFA (B). Docking results with X-ray structure PDB ID: 4EY7 as a target are shown. (C) Free energy (PMF) profile of the binding process calculated with REMD-US method. Process coordinate ξ is the distance between the TFK/TMTFA trifluoroketone group and the active site, oxyanion hole and catalytic serine hydroxyl-group.

