Figure 1.
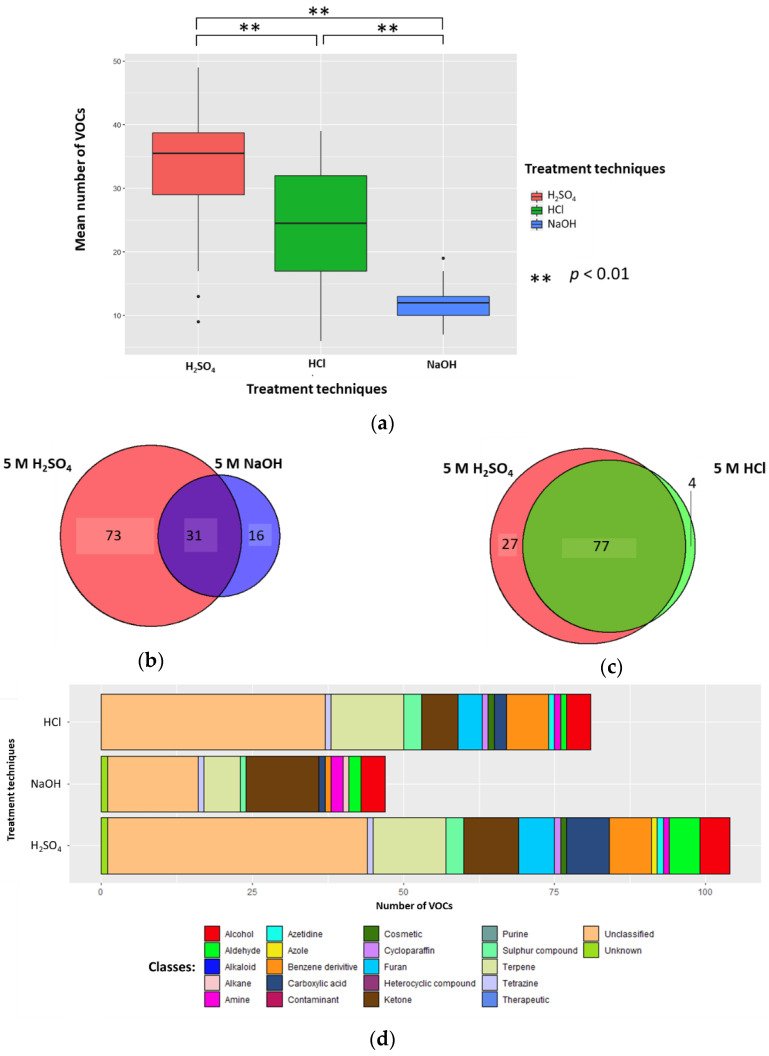
The urinary volatile organic compound (VOC) profiles after treatment with 5 M H2SO4 (red), 5 M NaOH (blue), or 5 M HCl (green) in the samples (to generate sample solutions of 0.83 M; pH 0.075, pH 0.081, and pH 13.919, respectively) (n = 26). (a) Boxplot to show the number of VOCs produced per treatment technique. (b) Venn to show the cumulative number of unique VOCs produced via addition of H2SO4 and NaOH. (c) Venn to show the number of VOCs produced via addition of H2SO4 and HCl. (d) Chemical classes of compounds produced when H2SO4, NaOH, and HCl were used as treatment techniques.

