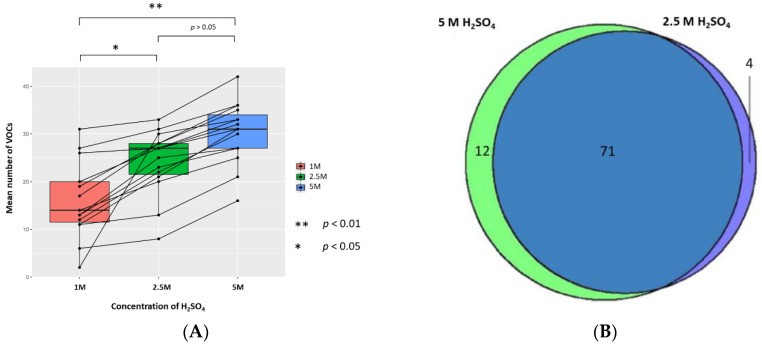
Figure 3.
The urinary VOC profiles using 1 M (red), 2.5 M (green), and 5 M of H2SO4 (blue) as the treatment technique (to generate sample solutions of 0.17 M, 0.42 M, 0.83 M, pH 0.743, pH 0.365, and pH 0.075 respectively) (n = 15). (A) Paired boxplot to show the cumulative number of unique VOCs produced per sample for each concentration of H2SO4. (B) Venn diagram showing the unique VOCs detected between 5 M and 2.5 M H2SO4.

