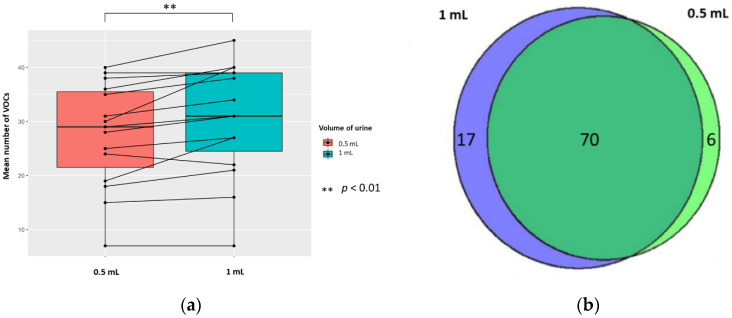
Figure 5.
The urinary VOC profiles using 0.5 mL (red) and 1 mL of urine (blue) (n = 15) treated with 5 M H2SO4, to yield 0.83 M final solution, pH 0.075. (a) Paired boxplot to show the cumulative number of unique VOCs produced per sample for either volume of urine. (b) Venn diagram showing the unique VOCs detected in each volume of urine.

