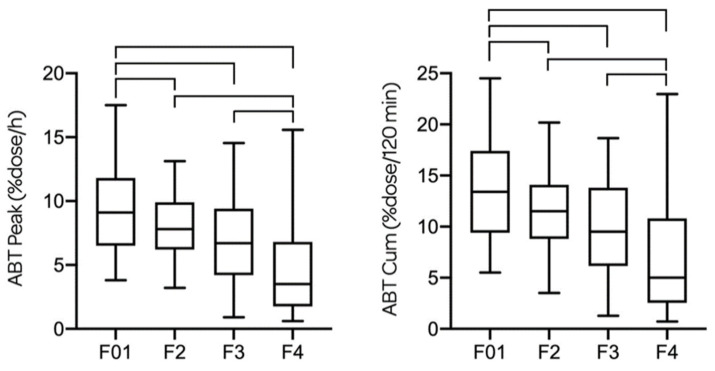
Figure 2.
ABTpeak and ABTcum are given for every fibrosis stage in all patients. There is a significant difference of ABTpeak between F2–F4 (p < 0.0001) and F3–F4 (p = 0.008), but not between F2–F3 (p = 0.133). There is a significant difference of ABTcum between F2–F4 (p < 0.0001) and F3–F4 (p = 0.013), but not between F2–F3 (p = 0.119). The ABTpeak and ABTcum are both significantly higher for F0–1 compared to F2 (p < 0.05), F3 (p < 0.001) and F4 (p < 0.0001).

