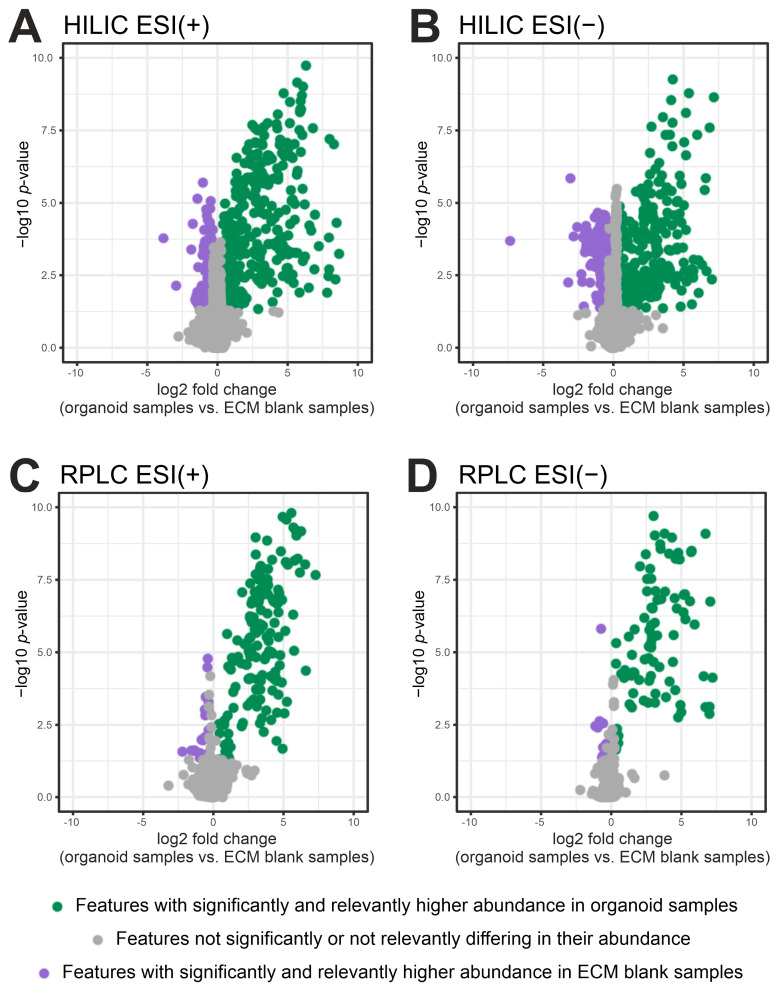
Figure 2.
Volcano plots comparing the abundance of features detected in organoid samples (n = 5) and ECM-blank samples (n = 3): (A) HILIC ESI (+) mode; (B) HILIC ESI (−) mode; (C) RPLC ESI (+) mode; (D) RPLC ESI (−) mode. Features with significantly and relevantly higher abundance in organoid samples (fold change (FC) > 1.2, p < 0.05, HILIC ESI (+)/(−): 311/299 features and RPLC ESI (+)/(−): 149/92 features) are colored in green and are considered to be cell derived. Features with significantly and relevantly higher abundance in ECM-blank samples (FC < 0.8, p < 0.05, HILIC ESI (+)/(−): 113/117 features and RPLC ESI (+)/(−): 25/13 features) are colored in purple. Grey dots represent features not significantly or not relevantly differing in their abundance (HILIC ESI (+)/(−): 1170/735 features and RPLC ESI (+)/(−): 406/217 features). Purple and grey features were considered to represent uninformative background signals and were removed prior to subsequent statistical analysis.

