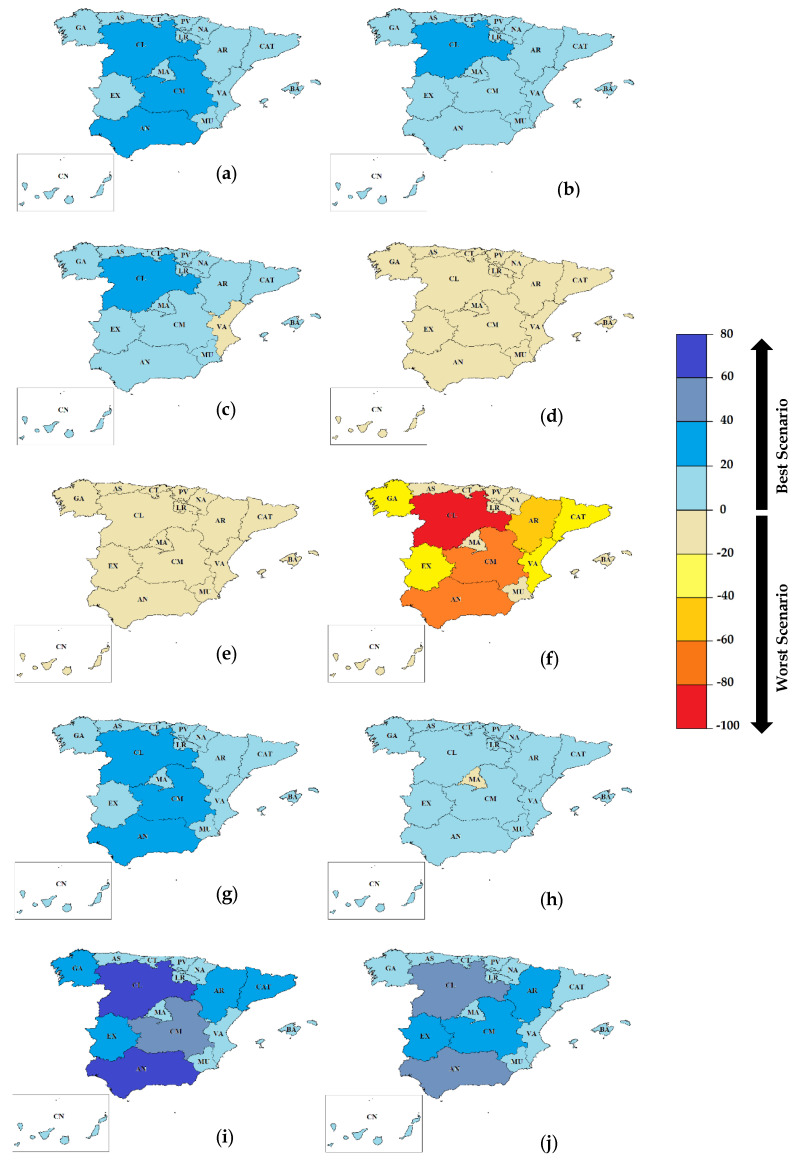
Figure 6.
Relative variation (%) of greenhouse gas (GHG) emissions as compared to the current scenario (S1) per region for the considered FLW management scenarios. Scenario S2: (a) BAU and (b) 2DS; scenario S3: (c) BAU and (d) 2DS; scenario S4: (e) BAU and (f) 2DS; scenario S5: (g) BAU and (h) 2DS; scenario S6: (i) BAU and (j) 2DS.

