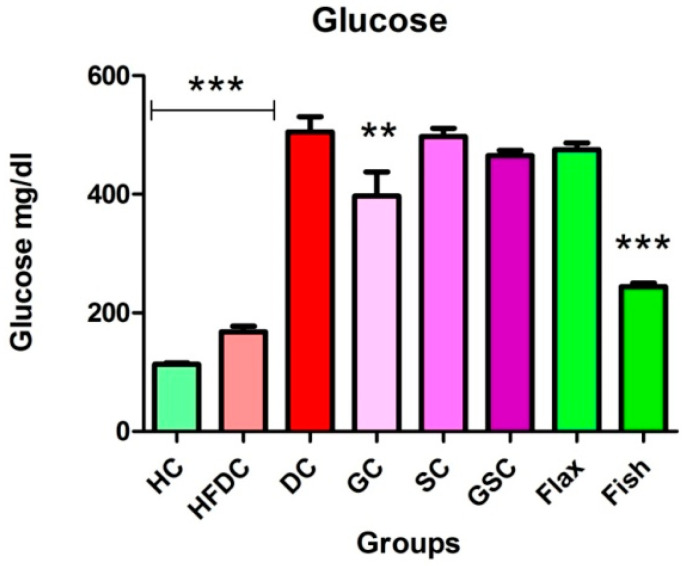
Figure 4.
Fish oil intervention lowered serum glucose Results are represented as Mean ± SE (n = 6 for each group). ** p ≤ 0.01 and *** p ≤ 0.001, when compared with the DC group (Dunnett’s Multiple Comparisons Test). HC: Healthy control, HFDC: High fat diet control, DC: Diabetes control, GC: Glibenclamide control, SC: Statin control, GSC: Glibenclamide statin control.

