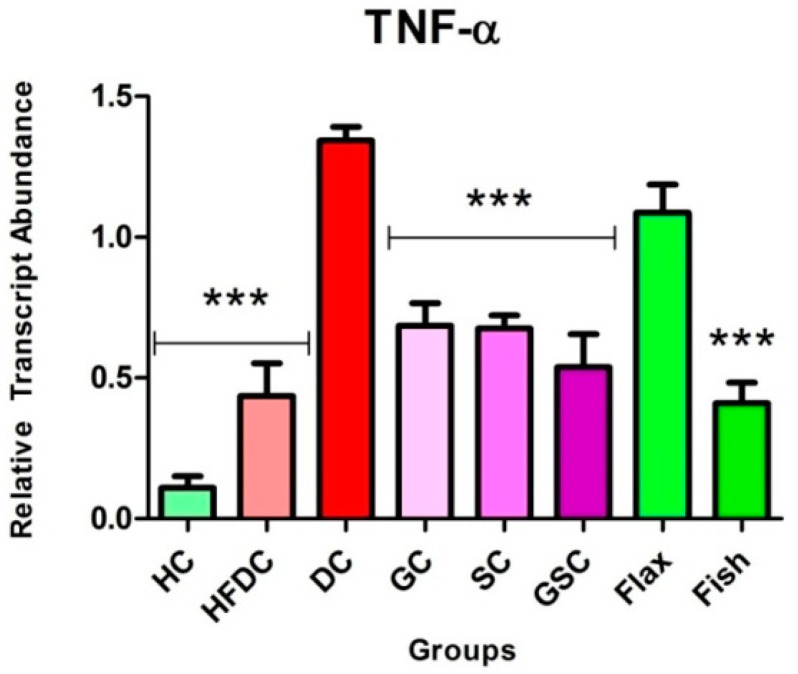
Figure 10.
Expression of TNF-α in experimental groups. Results are represented as Mean ± SE (n = 3 for each group). *** p ≤ 0.001, when compared with the DC group (Dunnett’s Multiple Comparisons Test). HC: Healthy control, HFDC: High fat diet control, DC: Diabetic control group-treated STZ and TNF-α: Tumor necrosis factor-alpha.

