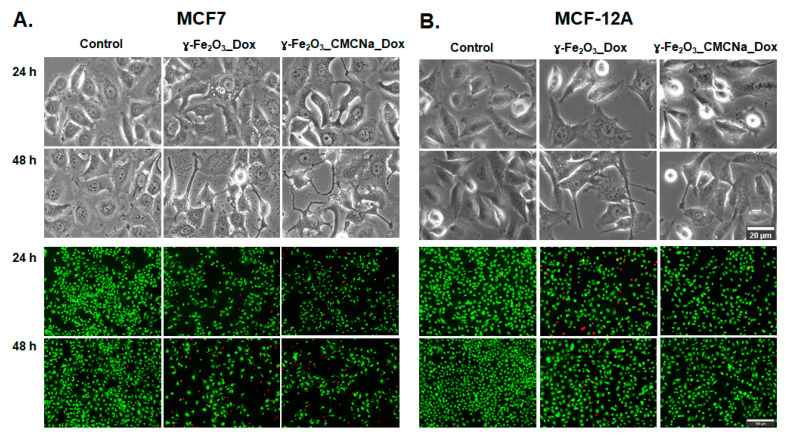
Figure 9.
Cell morphology (bright-field images) and Live/Dead staining (fluorescence images) for MCF7 (A) and MCF-12A (B) cells after 24 and 48 h incubation with a dose of 12.5 µg/mL γ-Fe2O3 + 100 ng/mL DOX γ-Fe2O3_DOX and γ-Fe2O3_CMCNa_DOX. Scale bar for bright-field images = 20 µm; scale bar for fluorescence images = 100 µm.

