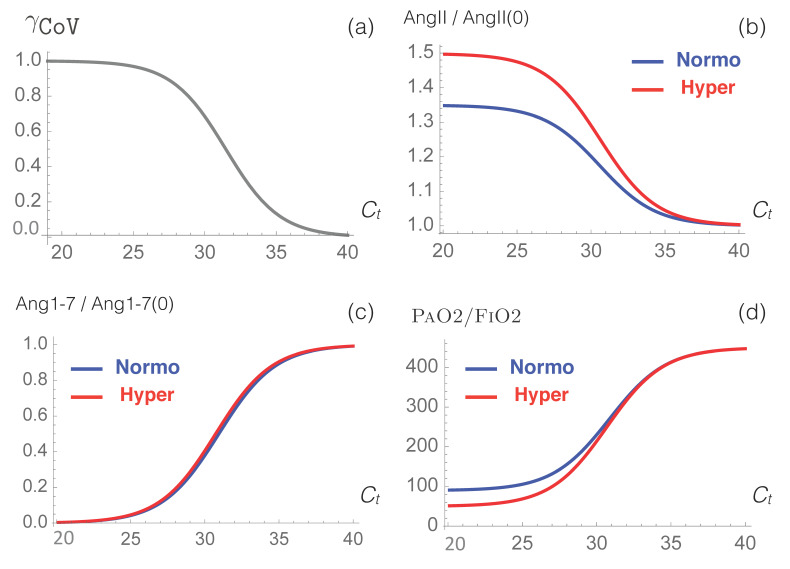
Figure 3.
Simulated response of RAS to viral infection. (a) The function used to model the effect of the infection as a function of , the cycle threshold of the virus. (b–d) Predictions obtained from our model for the normalized levels of AngII and Ang1-7 and for the physiological PaO2/FiO2 value, as a function of , for normotensive (blue) and hypertensive (red) individuals.

