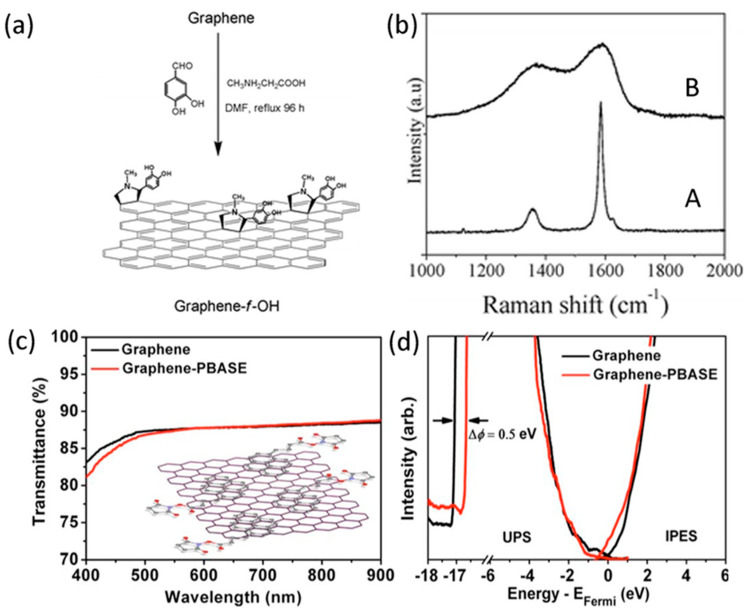
Figure 3.
(a) Schematic diagram of modified functional groups on the surface of graphene. (b) Raman spectra of (A) starting graphene and (B) graphene-f-OH. Transmission spectrum. Reproduced from [65] with the permission from Royal Society of Chemistry. (c) and UPS and IPES combined spectrum. (d) of graphene film before and after modification. Inset in (c): schematic diagram of PBASE modified graphene. Reproduced from [66] with the permission from American Chemical Society.

