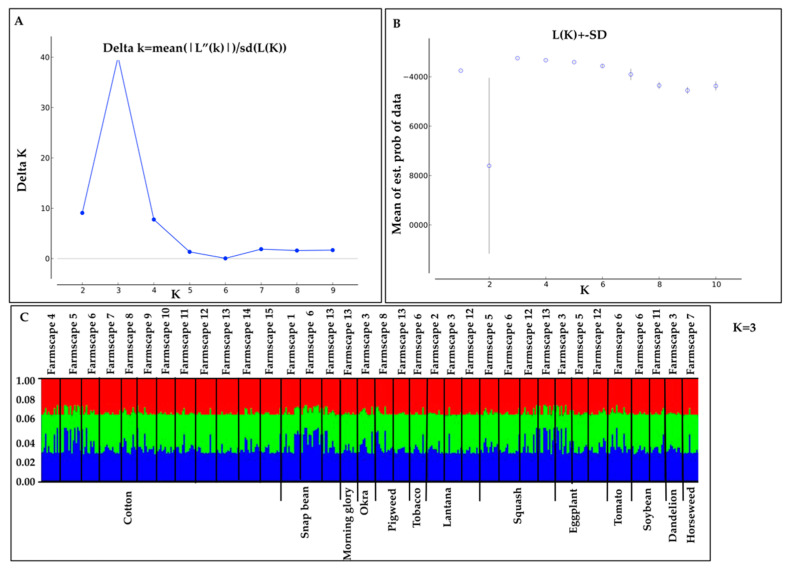
Figure 3.
Bayesian clustering analysis results for 35 B. tabaci MEAM1 populations based on six microsatellite markers using STRUCTURE v.2.3.2. (A) Optimal number of genetic clusters (K = 3) following methods described by Evanno et al. 2005. (B) Plot of average likelihood L(K) and variance per K. (C) Scatter plots at K = 3. The length of each line in the bars represents the proportion of the genome in different clusters. Whitefly populations collected from different host plants or farmscapes are separated by a continuous vertical black line.

