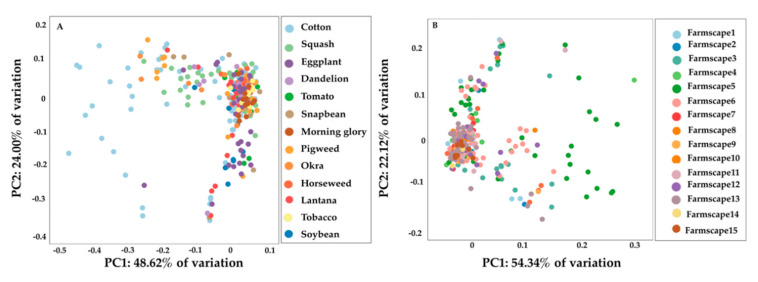
Figure 5.
Population structure based on principal component analysis for B. tabaci MEAM1 populations collected from different host plants (A), and farmscapes (B). Dots represent single individuals within the populations. All individuals are clustered together indicating minimum genetic isolation between individuals.

