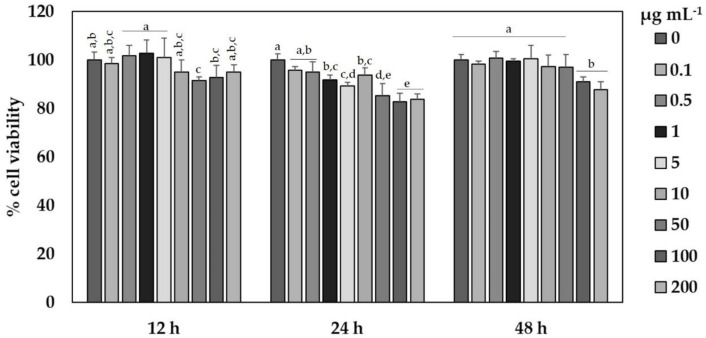
Figure 6.
Time course of cytotoxic effect on the viability of HaCaT keratinocytes of different concentrations (0–200 µg extract mL−1) of the optimized SFE extracts derived from Naxos (SFE-NX) by-products. Cell viability was determined using an MTT assay and expressed as percentages of the control. Values are given as the mean ± SD of six replicates. Different letters (a–e) denote statistically significant differences within each time according to Tukey’s test (p < 0.05).

