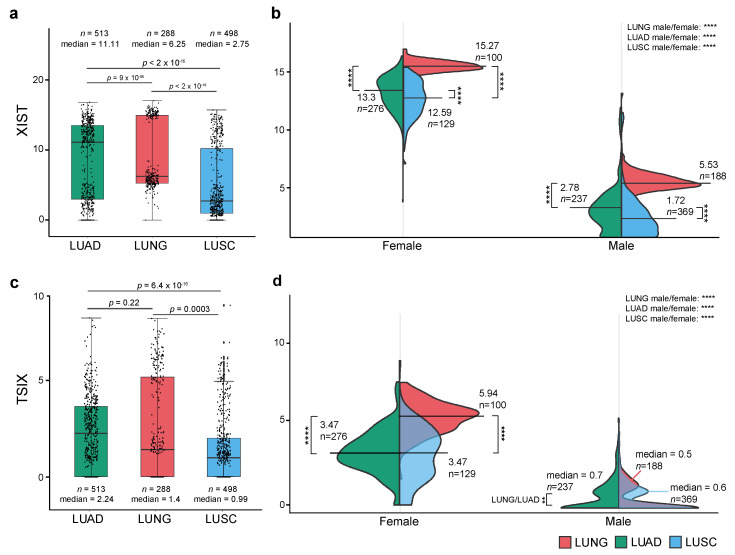
Figure 2.
XIST and TSIX expression. (a) Boxplots of the overall XIST expression in LUAD, LUSC and normal lung (LUNG), (b) Violin plots of the gender-specific expression of XIST in LUAD, LUSC and LUNG, (c) Boxplots of the overall TSIX expression in LUAD, LUSC, and LUNG (d) Violin plots of the gender-specific expression of TSIX in LUAD, LUSC, and normal lung. All expression data is presented in units of log2(norm_count + 1). Median expression and total sample size (count, n) are shown. p-values were calculated the Wilcoxon test in R, statistically, significant represented as ****: p ≤ 0.0001, non-significant results are not labelled in the graph.

