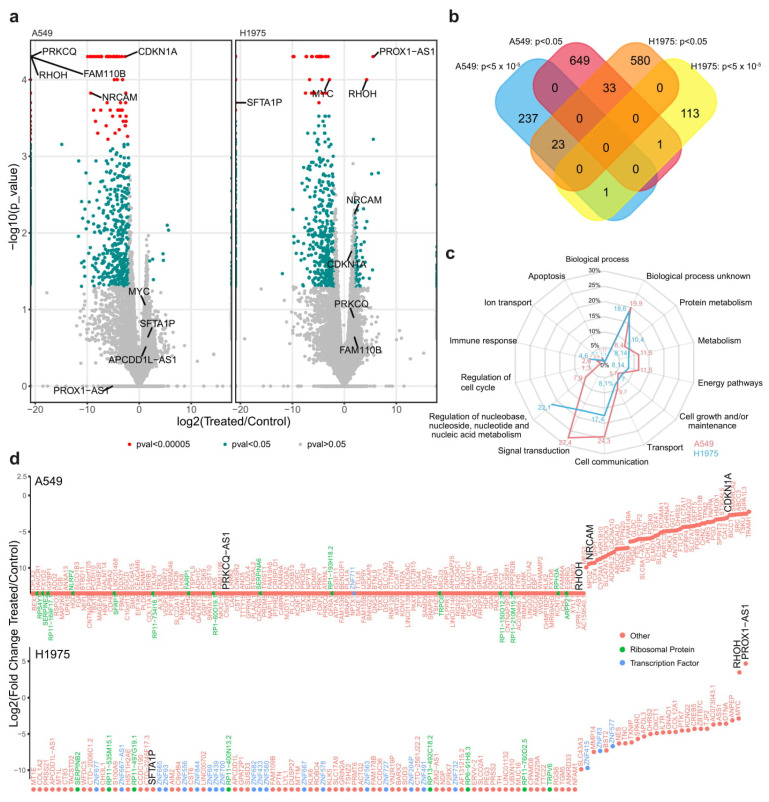
Figure 6.
(a) Vulcan plots for the A549 and H1975 gene expression. Data shows mostly up-regulation or down-regulation of genes in the siRNA XIST treated samples in comparison to non-treated ones (left of center = down-regulation, right of center = up-regulation), with a handful of genes shown to be very significantly up or down-regulated. (b) Venn diagram showing the total genes significantly dysregulated for both cell lines. (c) The biological processes where the down-regulated genes are found. Most of the dysregulated genes in both cells lines are playing a significant role in signal transduction (27.4% for the A549), cell-to-cell communication (24.3% for the A549 and 17.4% for the H1975) and regulation of nucleic acid metabolism (22.1% for the H1975 and 7.9% for the A549), (d) Ranking of all the highly significantly differentially expressed genes (DEGs) in both cell lines (p < 5 × 10⁻⁵).

