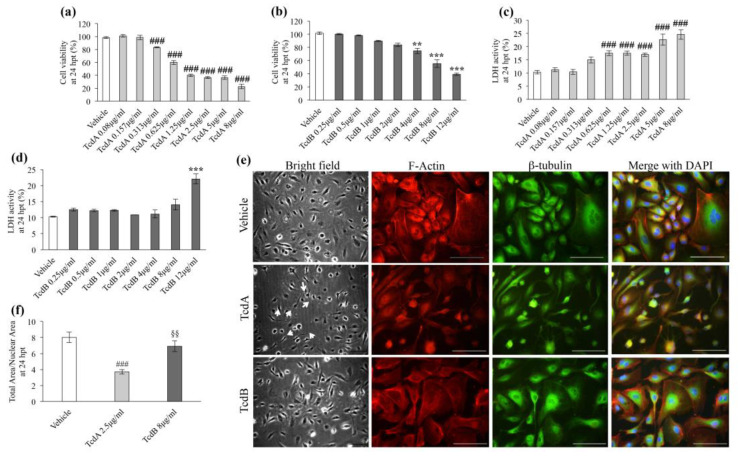
Figure 5.
C. difficile toxins induce different effects on the morphology of human umbilical vein endothelium cells (HUVEC). (a) Cell viability, evaluated by MTT assay, in HUVEC cells treated with vehicle and increasing doses of TcdA. Data, normalized to vehicle, are represented as the mean ± SEM. (n = 6), (### p < 0.001 compared to vehicle. (b) Cell viability, evaluated by MTT assay, in HUVEC cells treated with vehicle and increasing doses of TcdB. Data, normalized to vehicle, are represented as the mean ± SEM. (n = 6), (*** p < 0.001, ** p < 0.01 compared to vehicle. (c) Analysis of lactate dehydrogenase LDH activity on the supernatant of TcdA-treated HUVEC cells. Data, normalized to Triton X-100-treated cells, are represented as the mean ± SEM (n = 6), (### p < 0.001 compared to vehicle). (d) Analysis of lactate dehydrogenase (LDH) activity on the supernatant of TcdB-treated HUVEC cells. Data, normalized to Triton X-100-treated cells, are represented as the mean ± SEM (n = 6), (*** p < 0.001 compared to vehicle). (e) Representative images of HUVEC treated with vehicle, 2.5 μg/mL TcdA or 8 μg/mL TcdB for 24 h. Images of cellular morphology are taken in bright field (left) Scale bar = 50 µm. In the middle of the panel, images in red and green represent the F-actin and the β-tubulin staining, respectively. On the right, the merge of the red and green fields with DAPI (blue) was shown. Images were acquired with a Leica DM-2000 microscope. Scale Bar = 50 µm. (f) HUVEC cells rounding, expressed as the ratio of total to nuclear area, 24 h after addition of vehicle, 2.5 μg/mL TcdA and 8 μg/mL TcdB. Data are represented as the mean ± SEM (n = 20), (### p < 0.001 compared to vehicle, §§ p < 0.01 compared to 2.5 μg/mL TcdA).

