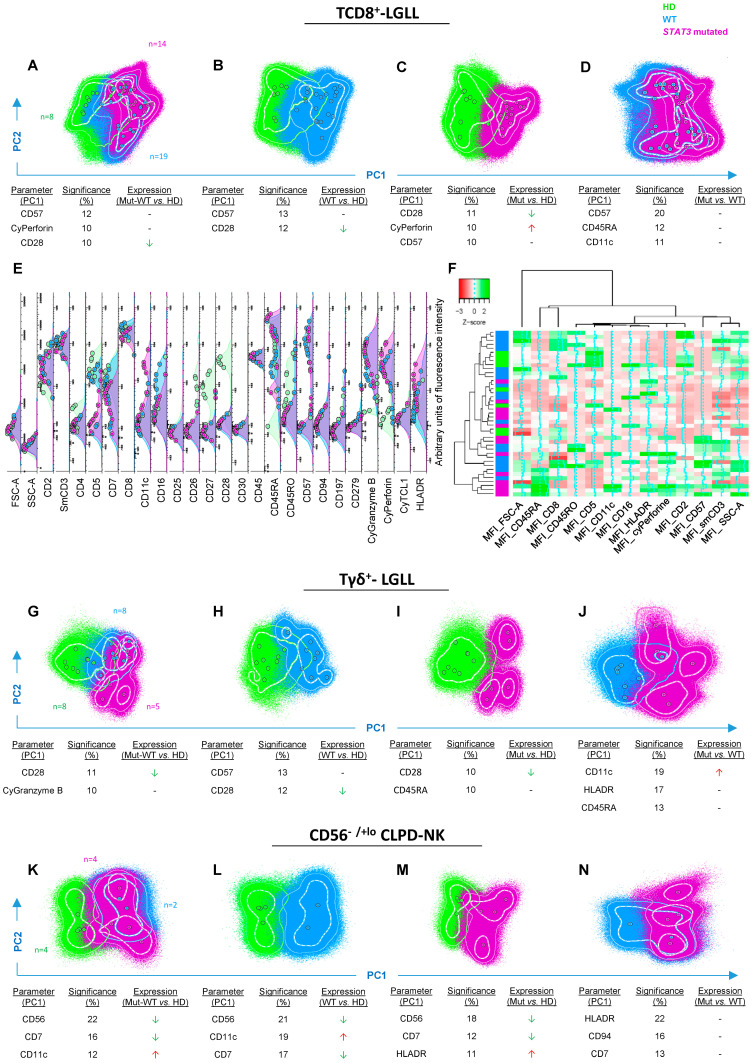
Figure 1.
Phenotypic profiles of STAT3-mutated vs. WT clonal TCD8+-LGLL, Tγδ+-LGLL, and CD56−/+lo CLPD-NK cell populations compared to their normal cell counterpart. Multidimensional phenotypic comparisons—principal component (PC) 1 vs. PC2, automatic population separator 1 (APS1) representations—showing those markers providing the best resolution (i.e., separation) between STAT3-mutated (depicted in purple) and WT (highlighted in blue) clonal LGL populations vs. normal cell populations (depicted in green). Overexpression (red arrows), underexpression (green arrows), or heterogeneous trend of expression (hyphen) of markers between the different set of cell populations. In all PC1 vs. PC2 (APS1) plots, solid circles represent median values for all phenotypic parameters evaluated, inner (dotted) and outer (solid) lines represent the first and the second SD for each population identified. (A): comparison between normal TCD8+-cell populations (n = 8) and both STAT3-mutated (n = 14) and WT (n = 19) clonal TCD8+-LGLL populations. (B): comparison between normal TCD8+-cell populations and WT clonal TCD8+-LGLL populations. (C): comparison between normal TCD8+-cell populations and STAT3-mutated clonal TCD8+-LGLL populations. (D): comparison between STAT3-mutated and WT clonal TCD8+-LGLL populations. (E): parameter band histogram of clonal STAT3-mutated (n = 14) and nonmutated (n = 19) clonal TCD8+-LGLL populations, as well as normal TCD8+ populations from adult healthy donors (n = 8) in which each solid circle represents median fluorescence intensity values per cell population. (F): heatmap representing hierarchical clustering analysis of the overall immunophenotype of clonal STAT3-mutated (n = 14) and nonmutated (n = 19) TCD8+-LGLL populations, compared to normal blood TCD8+ cells from adult healthy donors (n = 8). (G): comparison between normal Tγδ+ cells (n = 8) and both STAT3-mutated (n = 5) and WT (n = 8) clonal Tγδ+-LGLL populations. (H): comparison between normal Tγδ+ populations and WT clonal Tγδ+-LGLL populations. (I): comparison between normal Tγδ+ populations and STAT3-mutated clonal Tγδ+-LGLL populations. (J): comparison between STAT3-mutated and all WT clonal Tγδ+-LGLL populations. (K): comparison between normal blood CD56+lo NK cells (n = 4) and both STAT3-mutated (n = 4) and WT (n = 2) clonal CD56−/+lo CLPD-NK cell populations. (L): comparison between normal CD56+lo NK-cell populations and WT clonal CD56−/+lo CLPD-NK cell populations. (M): comparison of normal CD56+lo NK cells vs. STAT3-mutated clonal CD56−/+lo CLPD-NK cell populations. (N): comparison between STAT3-mutated and WT clonal CD56−/+lo CLPD-NK cell populations. Abbreviation: Cy, cytoplasmic; HD, healthy donors; MFI, median fluorescence intensity; Mut, STAT3-mutated; WT, wild-type.

