Figure 3.
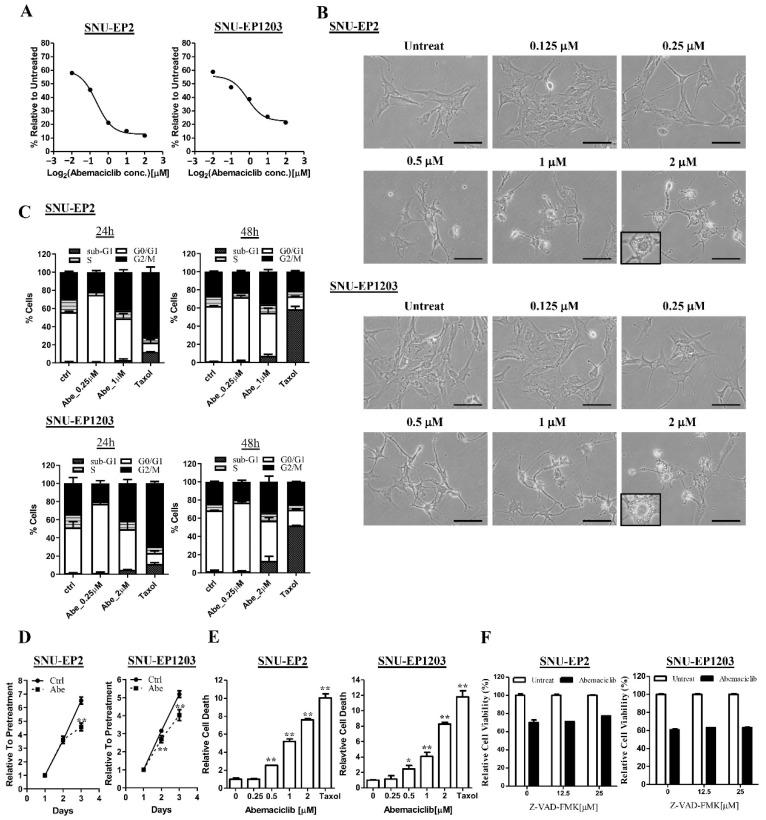
Abemaciclib treatment regulates cell proliferation and cell death in ependymoma cells. (A) SNU-EP2 and SNU-EP1203 cells were treated with abemaciclib for 72 h and the IC50 value was evaluated by using MTT assay. The IC50 value was 0.82 µM in SNU-EP2 and 0.89 µM in SNU-EP1203. Data are presented as the mean ± SD of triplicate wells and are representative of two independent experiments. (B) SNU-EP2 and SNU-EP1203 cells were treated with different concentrations of abemaciclib for 24 h and their morphology was examined by phase-contrast microscopy. Scale bar: 100 µm. (C) SNU-EP2 and SNU-EP1203 cells were exposed to the indicated concentrations of abemaciclib for 24 and 48 h and then subjected to cell cycle analysis. Data are presented as the mean ± SD (n = 2). Abe: abemaciclib. (D) Abemaciclib treatment (0.25 µM) reduced the cell proliferation rate in SNU-EP2 and SNU-EP1203 cells. ** p < 0.01. (E) SNU-EP2 and SNU-EP1203 cells were treated with different concentrations of abemaciclib and Taxol for 72 h and the cells were stained with trypan blue and dead cells were counted using the LUNA II cell counter. The number of dead cells was normalized to the untreated group. Data are presented as the mean ± SD of duplicate samples and are representative of three independent experiments. * p < 0.05, ** p < 0.01. (F) SNU-EP2 and SNU-EP1203 cells were treated with abemaciclib (1 µM) combined with the indicated concentration of Z-VAD-FMK for 72 h, and cell viability was assessed by using MTT assay. Data are presented as the mean ± SD of duplicate samples and are representative of three independent experiments.

