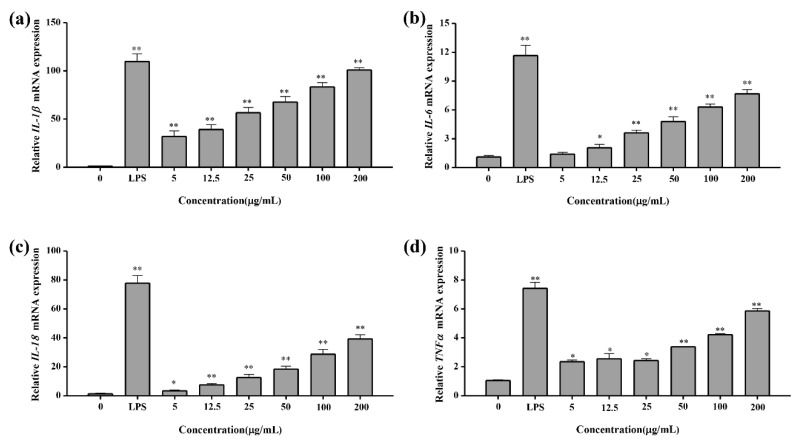
Figure 10.
Q-PCR test of cytokines. (a) IL-1β; (b) IL-6; (c) IL-18; (d) TNF-α. All Q-PCR treatments were performed in triplicate and repeated at least once, and the results were expressed by their means ±SD (standard deviation). Statistical significance of the treatment effects was determined by Duncan’s multiple range t-test. * (p < 0.05), ** (p < 0.01)

