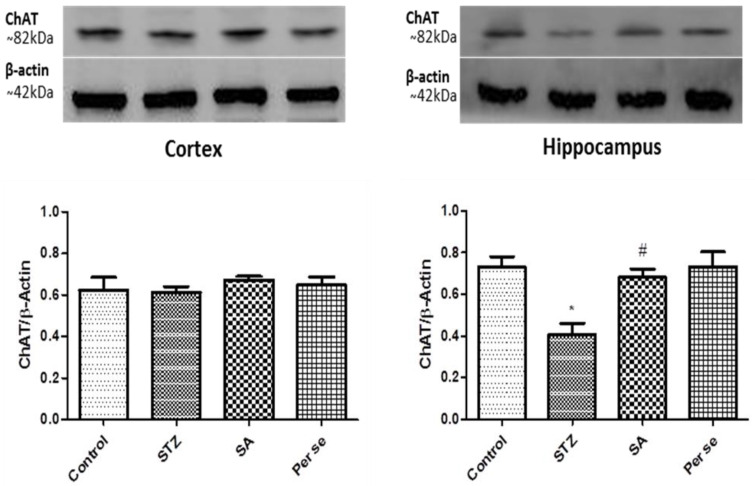
Figure 9.
Effect of SA on expression of ChAT in the cortex and hippocampus. Representative blots showing expression of ChAT in the cortex and hippocampus. Bar diagrams show change in ChAT expression when normalized against β-actin. Data are presented as mean ± SEM, (n = 4). * as compared to the sham group, # as compared to the STZ group. * p < 0.05, # p < 0.05. STZ—Streptozotocin, SA—Sinapic acid.

