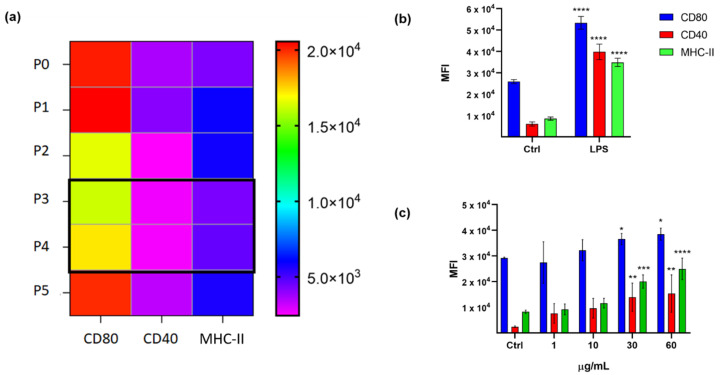
Figure 1.
(a) Mouse Dendritic cell line (D1) surface marker analysis of CD80, CD40, and MHC-II in each cell passage along 12 days (n = 6) from P0 to P5. The color bar on the right shows the MFI (mean fluorescence intensity) measured for each marker; (b) surface marker expression analysis of D1 untreated (Ctrl) and treated with LPS (10 µg/mL; 24 h) (n = 5); error bars indicate standard deviations; (c) MFI of CD80, CD40, and MHC-II in D1 cells treated with Sulfavant A compared with cells treated with vehicle (Ctrl = MeOH) (n = 7); error bars indicate standard deviations; asterisks indicate significant differences from Ctrl; * p < 0.5, ** p < 0.01, *** p < 0.001, **** p < 0.0001.

