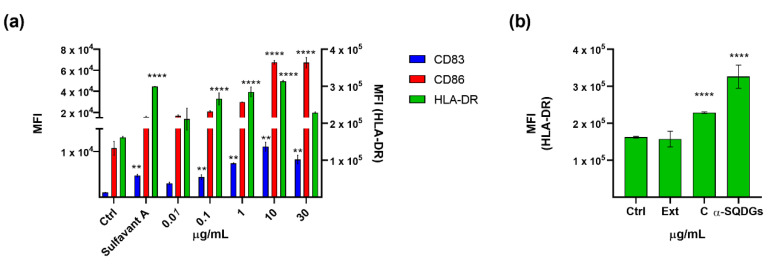
Figure 4.
(a) Surface expression analysis of CD83, CD86, and HLA-DR in MoDCs treated with the fraction C derived from the extract of Thalassiosira weissflogii from 0.01 to 30 µg/mL; all data were compared to the cells treated only with the vehicle (Ctrl) and cells treated with Sulfavant A (30 µg/mL); (b) HLA-DR analysis of MoDCs treated with extract (Ext), SPE C fraction and purified α-SQDGs at concentration of 30 µg/mL; error bars indicate standard deviations; ** p < 0.01, **** p < 0.0001.

