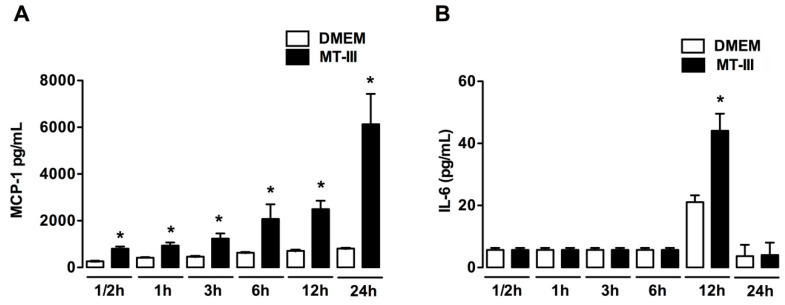
Figure 6.
MT-III induces MCP-1 and IL-6 production by 3T3-L1 preadipocytes. Cells were incubated with MT-III (0.4 μM), or DMEM (control) for ½ up to 48 h. Bar graphs show concentrations of (A) MCP-1 and (B) IL-6 released by cells incubated with MT-III. Cytokines concentrations were quantified in culture supernatants by Cytometric Bead Array (CBA). Results are expressed as mean ± SEM from 5 experiments. * p < 0.05 as compared with control group (two-way ANOVA and Bonferroni posttest).

