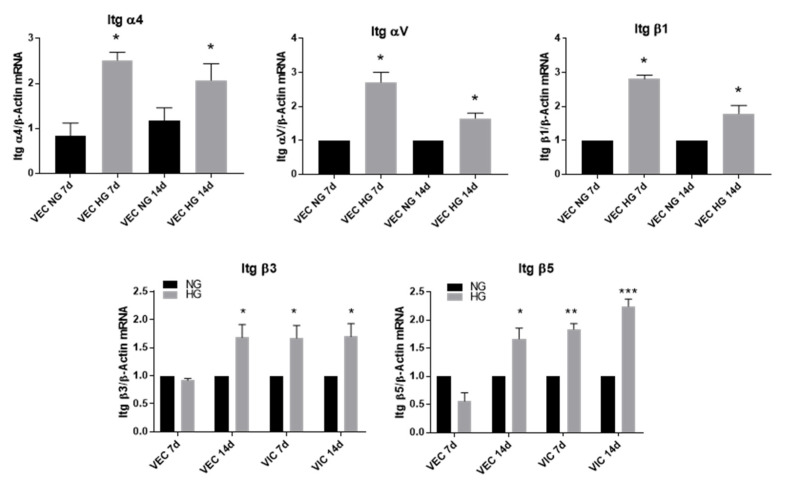
Figure 5.
Integrin gene expression in valvular cells (VEC and VIC) in the 3D model exposed to NG or HG concentrations of glucose for 7 and 14 days. Cells were isolated from 3D constructs after 7 and 14 days and investigated by quantitative polymerase chain reaction (qPCR). The results are presented as fold change versus NG condition for every type of cell and investigated time. N = 3, * p < 0.5, ** p < 0.01, *** p < 0.001.

