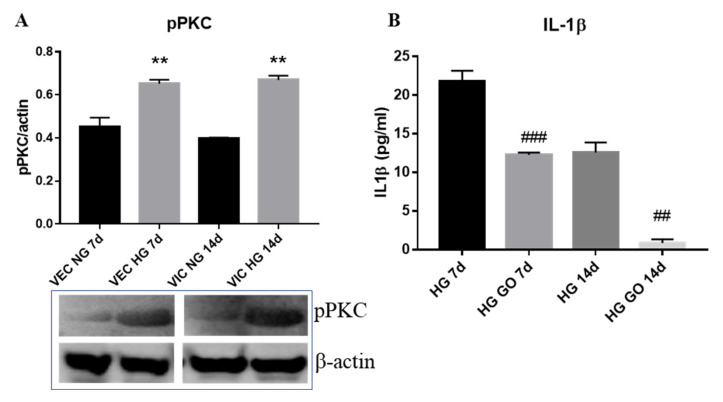
Figure 7.
(A) Expression of phosphorylated forms of PKC in VEC and VIC isolated from 3D model of aortic valve. Western blot was realized on cell lysate from valvular cells isolated from 3D construct after 7 and 14 days of glucose exposure. Compared to NG (black columns), cells from HG (grey columns) exhibit increased expression of pPKC-α. N = 3, ** p < 0.01. (B) Quantification of protein levels of IL-1β released by valvular cells from the 3D model exposed to HG level in the presence or absence of PKC inhibitor, GO 6983; ## p < 0.01, ### p < 0.001.

