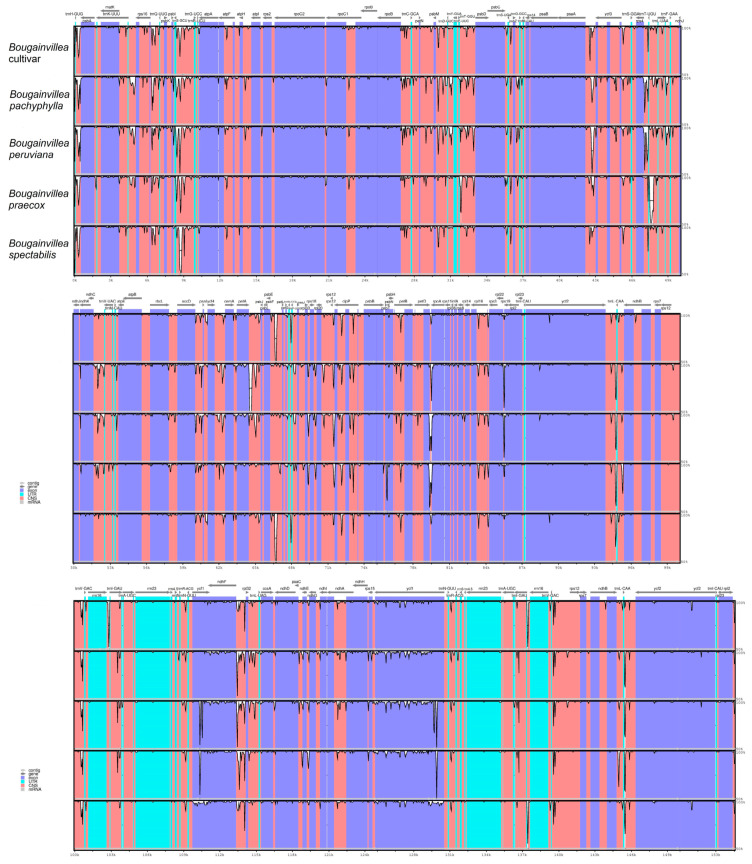
Figure 6.
Sequence identity plots (mVISTA) among Bougainvillea species. Alignments of the five Bougainvillea plastomes, with Bougainvillea glabra as the reference genome. Genes are color-coded, whereby pink regions represent conserved non-coding sequences (CNS) and purple regions indicate protein-coding sequences. Grey arrows above the alignments indicate gene directions. The y-axis denotes the percentages of identity, ranging between 50% and 100%.

