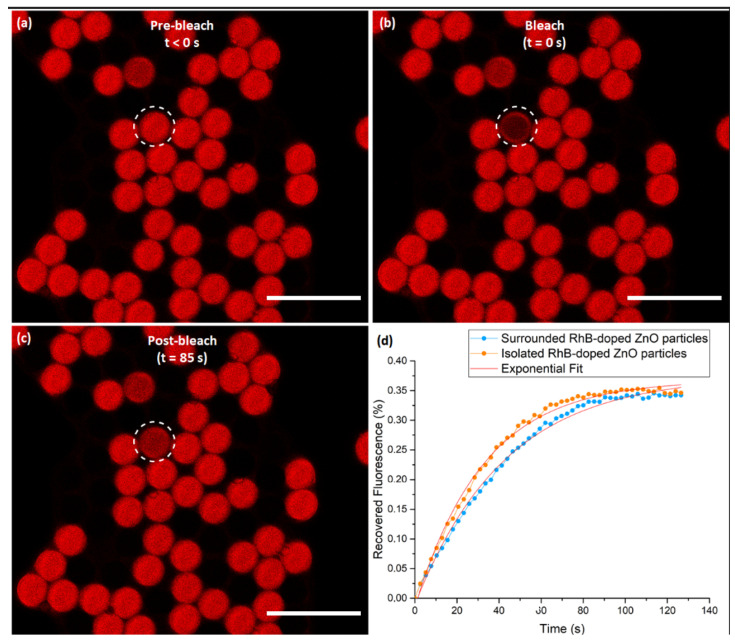
Figure 9.
Confocal microscopy images recorded during a FRAP experiment on ZnO microspheres uniformly labeled with rhodamine B dye: (a) taken before photobleaching; (b) immediately after photobleaching the spherical inner part of the microsphere, with short pulse of intense laser light, showing that the selective ROI is no longer fluorescent; (c) recorded during the recovery after photobleaching; and (d) the recovery curve that demonstrates an increase in fluorescence intensity as the bleached dye diffuses and the new unbleached dye move into the ROI. The white dashed circles represent the selected microsphere for photobleaching. Scale bars: 50 m.

