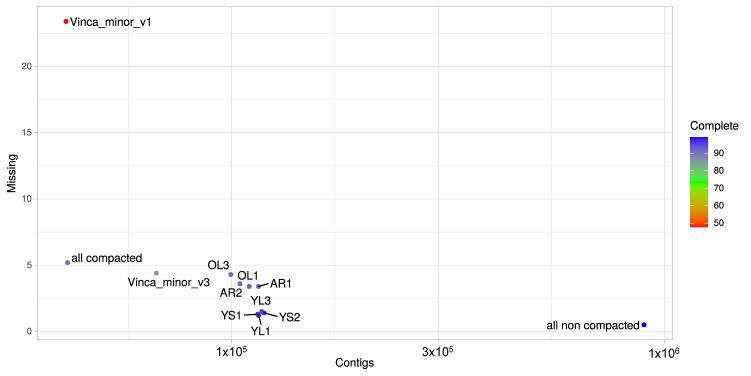
Figure 3.
BUSCO evaluation of transcriptome assembly quality. The number of missing BUSCOs is plotted against the total number of contigs. Colors correspond to the percentages of completed BUSCOs. BUSCO analysis was conducted for each individual sample transcriptome for old leaves light (OL), young leaves light (YL), young leaves shadow (YS) and adventitious roots (AR), and their merged transcriptome without (all non compacted) and with compaction (all compacted). BUSCO metrics were compared with available V. minor transcriptome resources including the 454 based assembly (Vinca_minor_v1) and the Illumina based assembly (Vinca_minor_v3).

