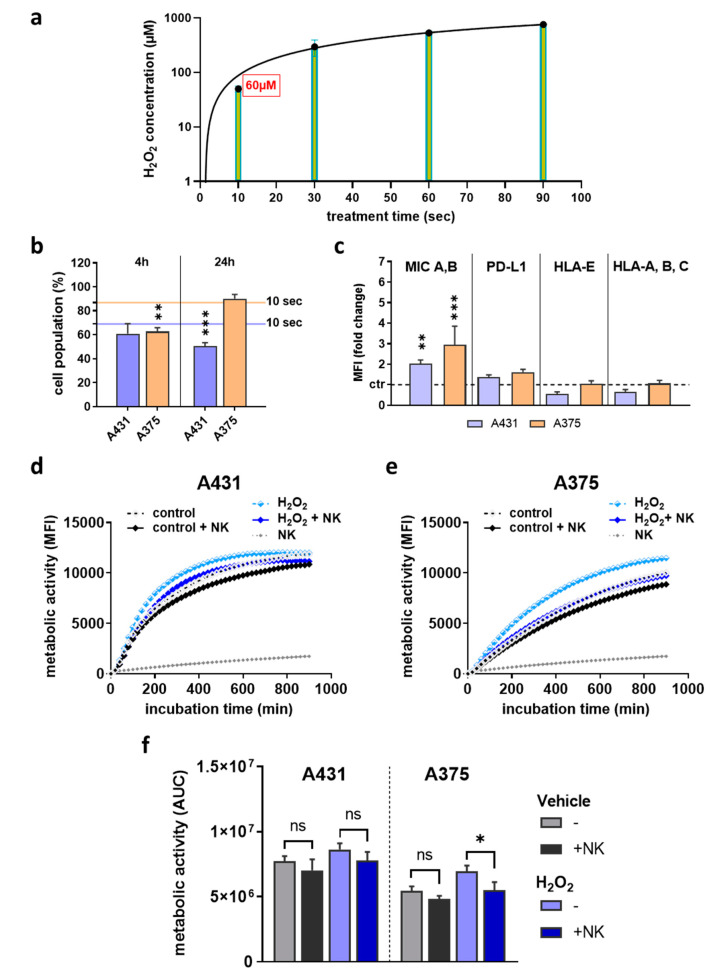
Figure 5.
H2O2 treatment did not replicate the results observed with plasma treatment. (a) 10 s of plasma treatment yielded approximately 60 µM of H2O2 in solution, which was subsequently used as control treatment; (b) cell viability of A431 and A375 cells at 4 h and 24 h after H2O2 treatment as determined using flow cytometry; (c) quantification of the expression of surface markers MIC A,B, PD-L1, HLA-E, and HLA-A,B,C in viable cells 24 h after H2O2 treatment using flow cytometry; (d–f) H2O2-treated or untreated A431 (d) and A375 (e) cells in presence or absence of NK-cells, and kinetic assessment of metabolic activity as well as AUC (f) of the data over 15 h. Data are mean of three independent experiments. Statistical analysis was performed using one-way ANOVA or t-test (* = p < 0.01, ** = p < 0.01, *** = p < 0.001). ns = not significant, AUC = area under the curve, MFI = mean fluorescent intensity.

