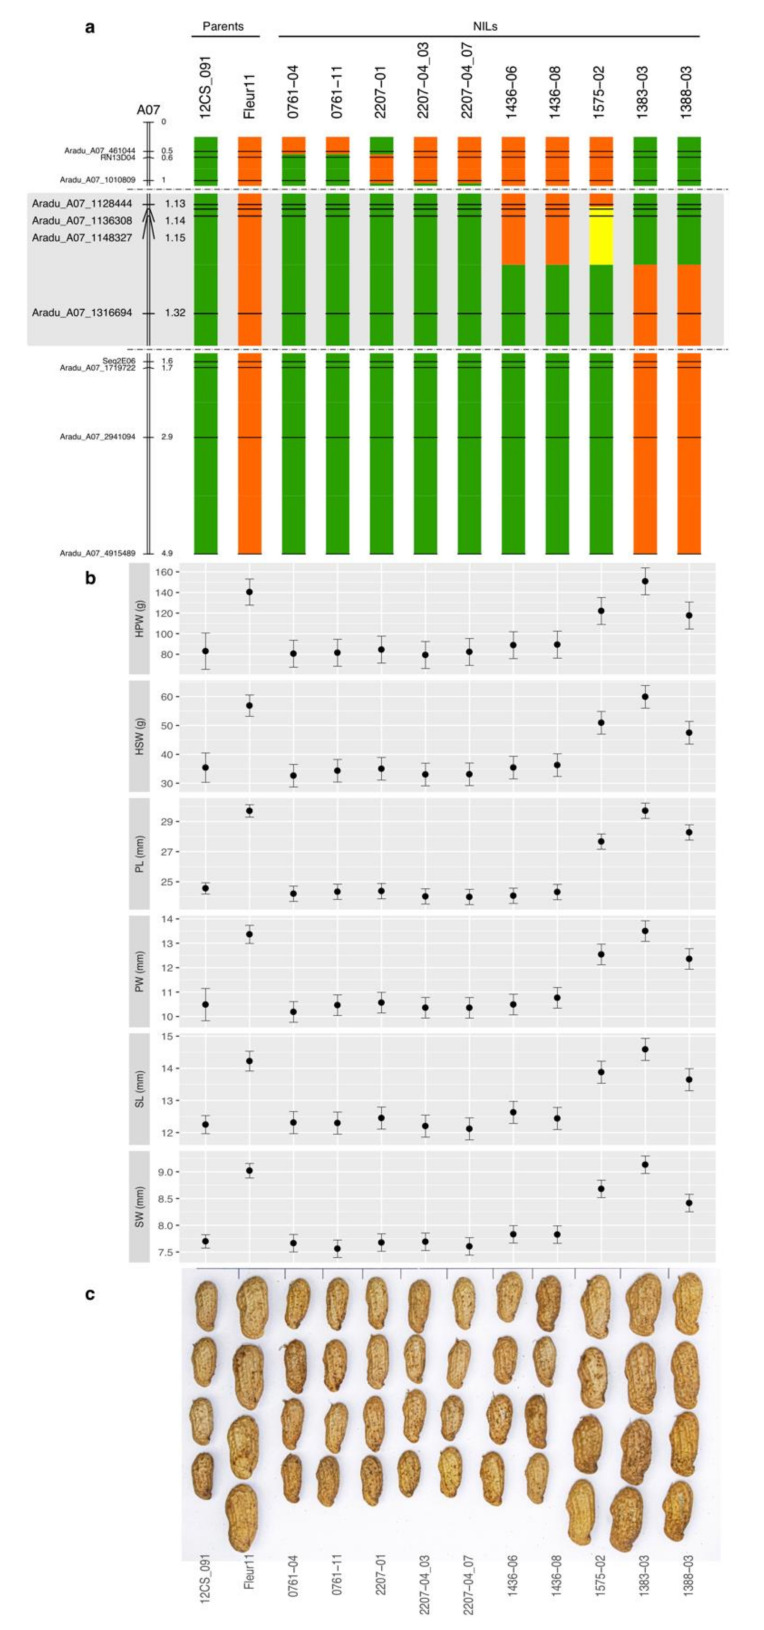
Figure 2.
(a) Graphical genotypes of the NILs. The names and physical positions (in Mb) of the markers are shown on the left, and the names of NILs and parents at the top of the graph. Homozygous Fleur11 alleles are represented in orange and homozygous A. duranensis alleles in green. The region with an homeologous exchange between A and B genomes are represented in yellow. The two parents (Fleur11 and 12CS_091) are presented before NILs on the left. In order to reveal recombination points between very close markers, the vertical scale has been stretched in the region represented with a grey background. (b) Comparison of the mean values between the genotypes for the six measured traits. (c) Photography of harvested pods for the different NILs and their parents.

