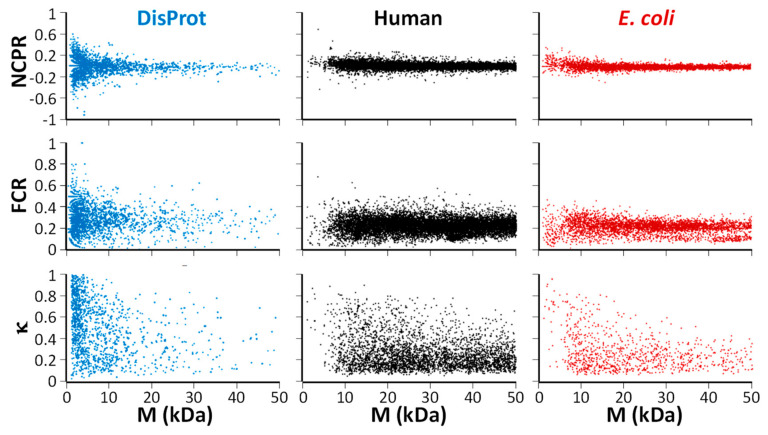
Figure 2.
Net charge per residue (NCPR; first row), fraction of charged residues (FCR; second row), and κ (third row) for proteins with masses up to 50 kDa for (first column; in blue) sequences in the DisProt database (all intrinsically disordered), (second column; in black) human proteins (ca. 30% disordered), and (third column; in red) E. coli (<5% disordered).

