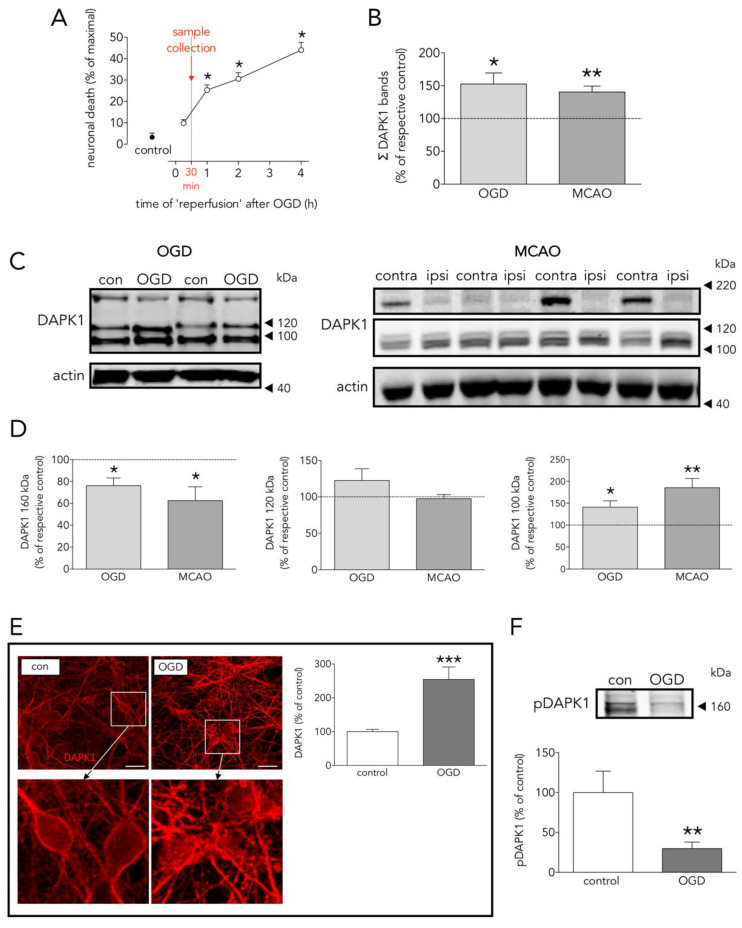
Figure 1.
Effects of OGD on neuronal death, and DAPK1 expression, cleavage, and dephosphorylation. (A) Effect of time of ‘reperfusion’ after OGD on neuronal death; as depicted, experimental samples were taken at 30 min for further processing (one-way ANOVA plus SNK, n = at least 5 independent primary neuron culture preparations, with at least 3 technical replicates each). (B) Effect of OGD and MCAO on total DAPK1 levels (OGD: t test, n = 3 independent primary neuron culture preparations, with 3 technical replicates each; MCAO: paired t test, n = 9 rats, comparing ipsilateral (ipsi, ischemic) brain hemisphere with the contralateral (contra, control) one). (C) WB showing the effect of OGD or MCAO on DAPK1 bands. (D) Quantification of the effect of OGD or MCAO on DAPK1 cleavage and levels of the resulting bands (OGD: t test, n = 3 independent primary neuron culture preparations, with 3 technical replicates each; MCAO: paired t test, n = 9 rats, comparing ipsilateral (ipsi, ischemic) brain hemisphere with the contralateral (contra, control) one). (E) Effect of OGD on DAPK1 levels as measured by immunocytochemistry; insets in the upper pictures are shown magnified in the bottom pictures (t test, n = 3 independent primary neuron culture preparations, with 5 technical replicates each). (F) WB and quantification of the effect of OGD on pDAPK1 levels (t test, n = 3 independent primary neuron culture preparations, with 3 technical replicates each). Results are shown as the mean and SEM. * p < 0.05, ** p < 0.01, *** p < 0.005 vs. respective control in all graphs. Scale bar: 30 µm. Note that in (B), total DAPK1 levels represent protein expression.

