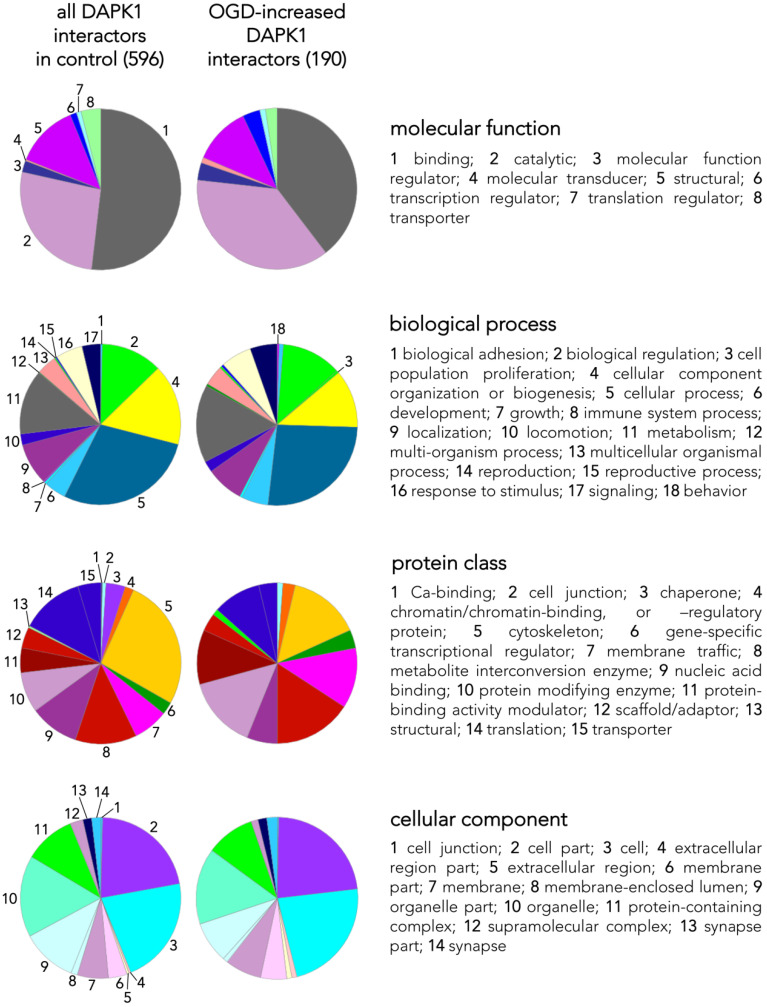
Figure 3.
Classes and categorization of proteins in the DAPK1 interactome. Panther™ v15.0 (pantherdb.org) was used to classify proteins of the DAPK1 interactome in control neurons and those interactors found increased in OGD-exposed neurons (they are shown in a pie chart on the left). Four main classes are defined, each encompassing a number of different categories encoded by colors and explained on the right side of each class.

