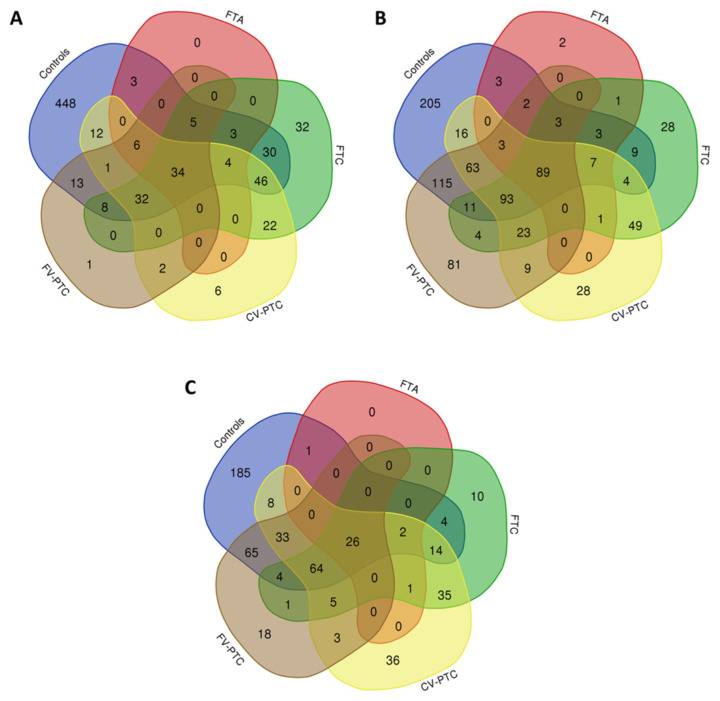
Figure 4.
Venn diagrams showing the number of shared and specific proteins identified in the PCs formed after the interaction of AgNPs (9.66 ± 1.77) (A), AuNPs (7.55 ± 0.70) (B), and FeNPs (8.25 ± 0.78) (C) with pooled tissue extracts from normal thyroid samples (controls), FTA samples, and samples from different types of thyroid cancers (FTC, CV-PTC, and FV-PTC).

