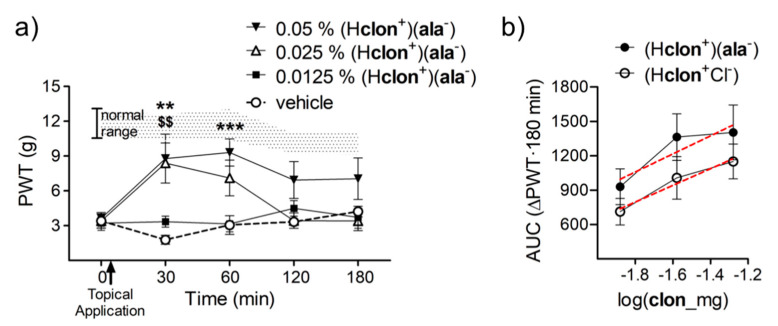
Figure 6.
The effect of topical application of ethanol solvated (Hclon+)(ala−) and how it compares to its generically available counterpart (Hclon+Cl−). (a) The time course of change in PWTs after topical application of different doses of (Hclon+)(ala−). The shaded area represents PWT values from vehicle-treated normal animals (** p < 0.01 and *** p < 0.001 pre-versus post-drug PWT of 0.05% w/w (Hclon+)(ala−) and $$ p < 0.01 that of 0.025% w/w) (n = 8). (b) The cumulative 3 h change in PWTs achieved by topical application of (Hclon+)(ala−) as compared to (Hclon+Cl−) shows a leftward shift in its dose–response curve implying a two-fold increase its potency (red line depicits regression line).

