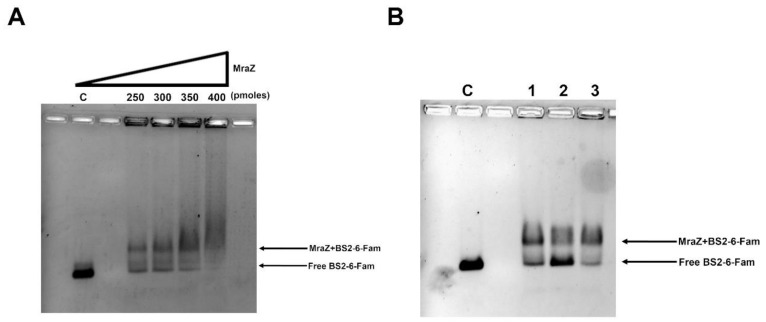
Figure 4.
Electrophoretic mobility shift assay of the MraZ protein. (A) The gel represents the band shift using a constant BS2-6-Fam DNA amount (C, 0.34 pmoles) and increasing quantities of MraZ. (B) Demonstration of the specificity of the binding of MraZ to the fragment BS2, using a fixed amount of protein (300 pmoles) and BS2-6-Fam (0.34 pmoles) (lane 1), a 20× excess of non-labeled BS2 fragment which competes for the binding of MraZ (lane 2), or a 20× concentration of non-specific, non-labeled competitor (a 250 bp cepI fragment) (lane 3).

