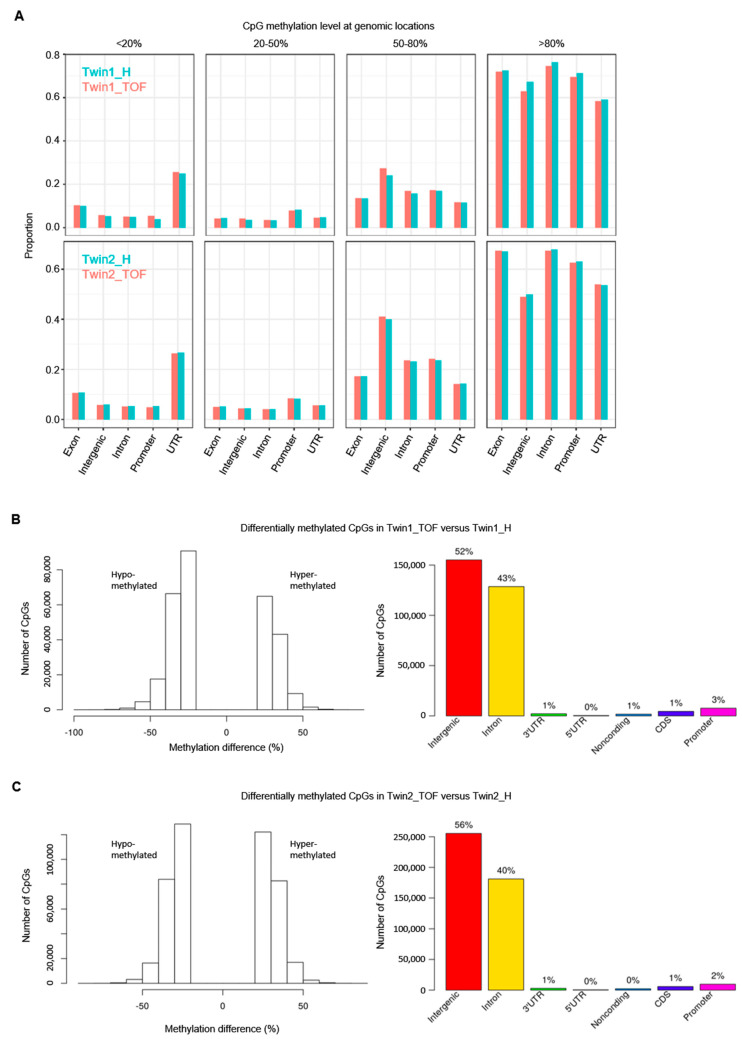
Figure 2.
DNA methylation levels and differences of CpG sites in twins and their genomic locations. (A) Overview of methylation levels of CpGs at genomic locations. Proportions of CpG are given over the total count for each feature (no pairwise comparison of single CpG sites). (B) Differentially methylated (hypo- and hyper-methylated) CpG sites in Twin1_TOF compared to Twin1_H and their genomic locations. (C) Differentially methylated (hypo- and hyper-methylated) CpG sites in Twin2_TOF compared to Twin2_H and their genomic locations. Differentially methylated CpGs with at least 25% methylation difference between affected (*_TOF) and healthy (*_H) twin.

