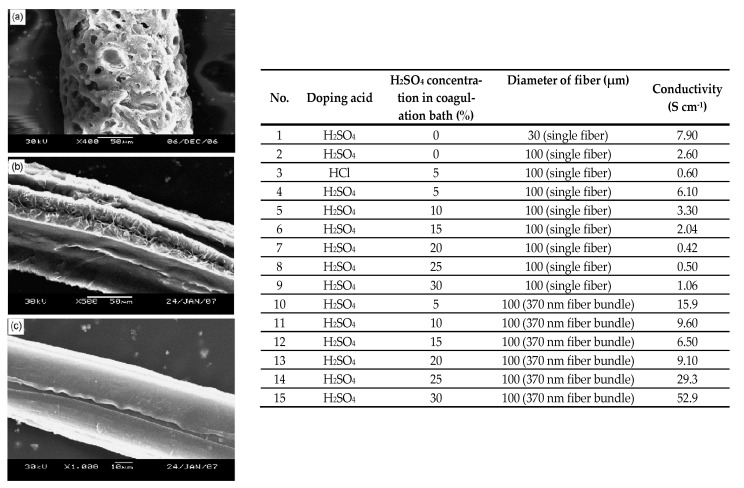
Figure 14.
Left: SEM images of H2SO4-doped PAni fifibers obtained from different H2SO4 concentration contained in coagulation bath: (a) 15%, (b) 5%, and (c) 0%. Right: Table summarizes the conductivity of PAni sub-micron fibers from electrospinning [47].

