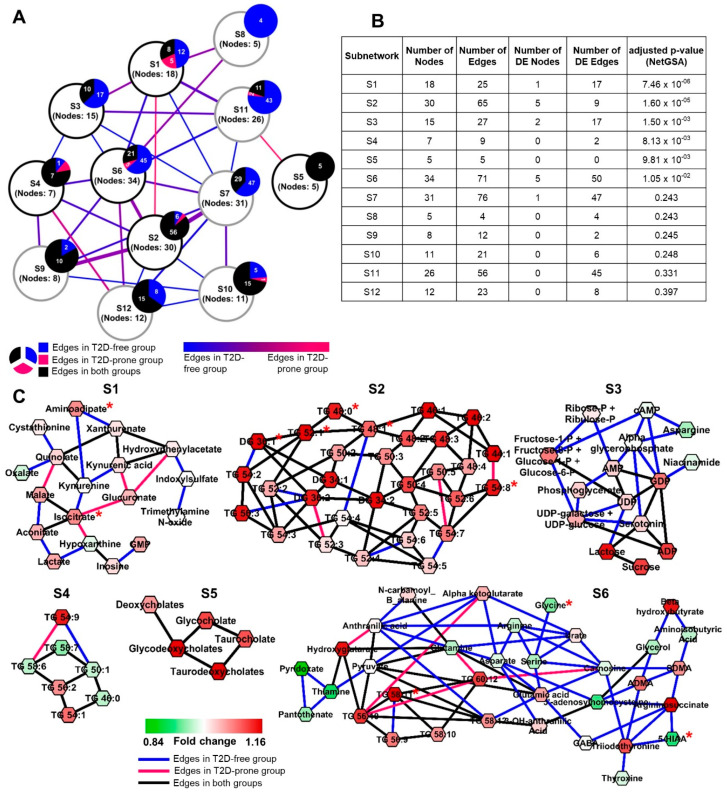
Figure 3.
(A) Overview of the Framingham Heart Study Offspring Cohort T2D network showing associations between all the subnetworks. Each node represents a subnetwork with the overlaying pie charts showing the distribution of the intra-subnetwork edges. Inter-subnetwork edges are weighted by the total number of edges. Nodes with black outline are significantly differential by NetGSA. (B) NetGSA output showing subnetwork information and statistics. (C) Significantly differential subnetworks. Nodes are colored based on fold change (T2D-prone over T2D-free). Nodes marked with red asterisk (*) have been reported as T2D predictors by Merino and colleagues (2018).

