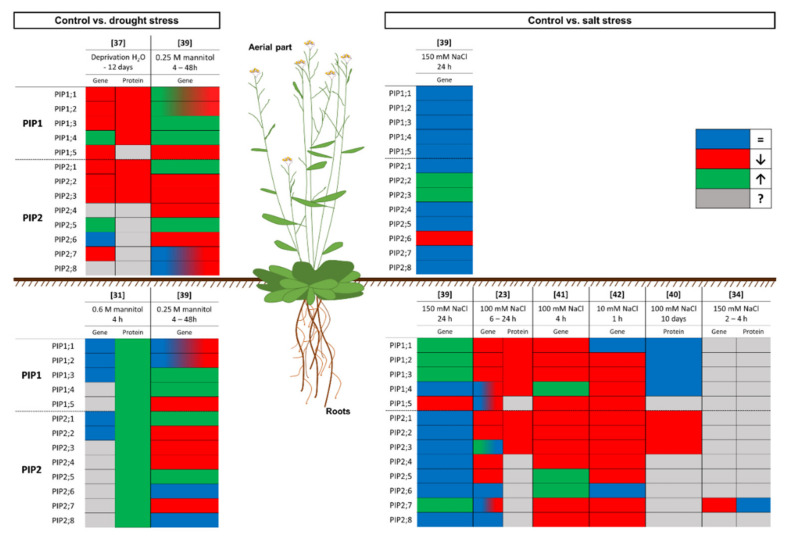
Figure 1.
Graphical summary of the response of the model plant Arabidopsis thaliana to drought and salinity stress at the gene expression and protein levels. The box colour indicates the response of the plant compared to control conditions: the gene expression or protein amount does not change (blue), decreases (red), or increases (green); or unknown data (grey). Numbers in brackets refer to the related bibliography.

