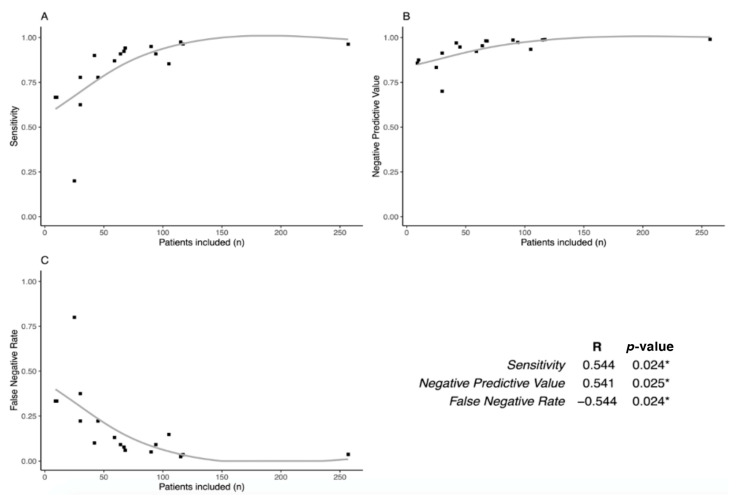
Figure 5.
Learning curve of the SLN technique. Plots comparing Sensitivity (a), Negative Predictive Value (b), and False Negative Rate (c) to the number of patients included for each study. The table shows the correlation between these performances and the number of patients: Sensitivity and Negative Predictive Value are correlated (p = 0.024 and p = 0.025, respectively), while False Negative Rate is inversely correlated with the number of patients included (p = 0.024). * means a significative p-value (< 0.05).

