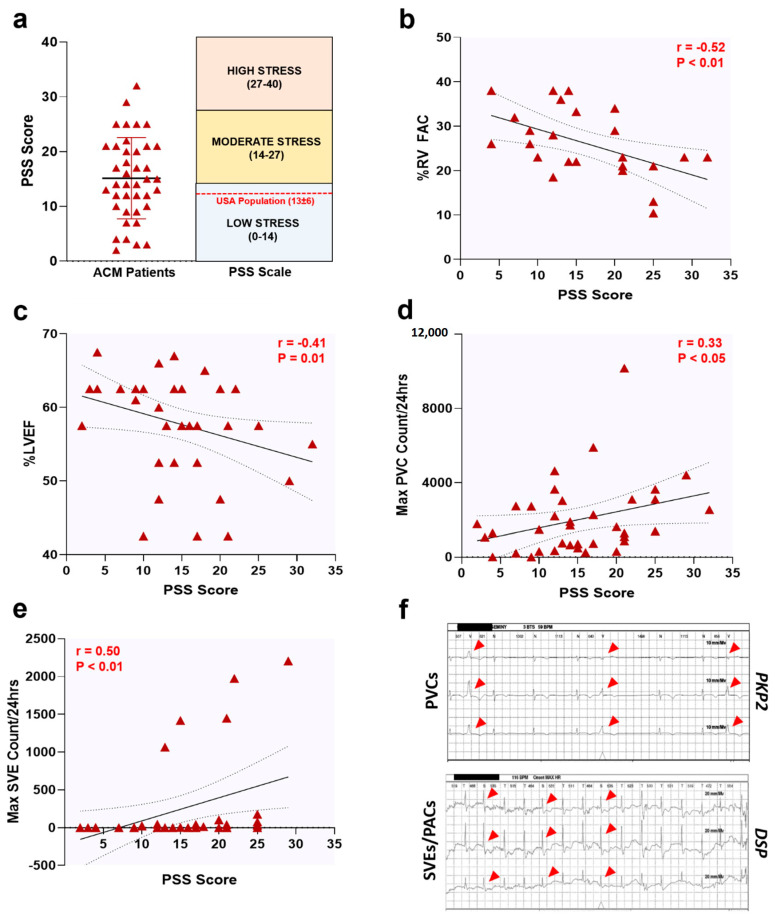
Figure 1.
Perceived stress levels correlate with cardiac dysfunction in ACM patients. (a) PSS scores in n = 40 ACM patients. Data presented as Mean ± StDev. Upon further analysis, PSS scores correlated with ACM patient phenotypes; notably, (b) percent right ventricular fractional area change (%RV FAC), (c) percent left ventricular ejection fraction (%LVEF), (d) maximum premature ventricular contractions per 24 h (Max PVC Count/24 h), and (e) maximum supraventricular ectopics per 24 h (Max SVE Count/24 h). Data displayed in scatterplots; thick black line shows the best linear fit through the data; dotted lines represent two-tailed 95% confidence interval; text inset reports Spearman’s Rho value and associated p-value. For (a–e), each maroon triangle is an individual data point from a single patient. (f) Representative Holter strips showing PVCs (top panel) and SVEs (lower panel) from ACM patients harboring a Plakophilin-2 (PKP2) and Desmoplakin (DSP) pathogenic variant, respectively. Red arrowheads, PVCs and SVEs.

