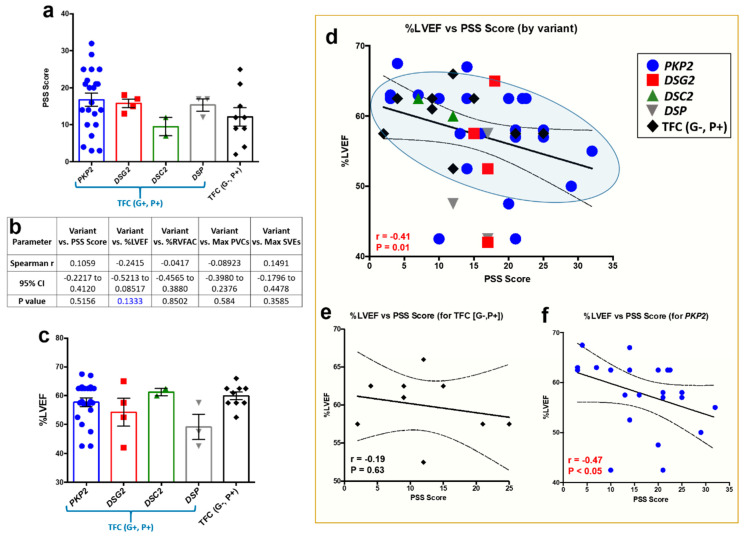
Figure 2.
Multivariate analysis between perceived stress levels, pathogenic variant, and functional phenotypes in ACM patients. (a) PSS scores in n = 40 ACM patients, sorted by ACM patients with a pathogenic variant (i.e., TFC (G+, P+)) and gene-elusive patients (i.e., TFC (G−, P+)). No significance to note. (b) Multivariate analysis demonstrated a trend between presence of a pathogenic variant and %LVEF (noted in blue text). (c) Even though a trend was found between variant and %LVEF, no significant differences in %LVEF were found between cohorts. (d) However, color-coating each data point by variant or gene-elusive status indicated PKP2 patients (blue circles) and TFC (G−, P+) patients (black diamonds) abundantly fell within the 95% confidence interval between PSS scores and %LVEF correlation analysis. (e,f) Yet, only PKP2 patients showed a strong correlation between PSS scores and %LVEF. For (a,c), data presented as mean ± SEM. For (d–f), data displayed in scatterplots; thick black line shows the best linear fit through the data; dotted lines represent two-tailed 95% confidence interval; text inset reports Spearman’s Rho value and associated p-value.

