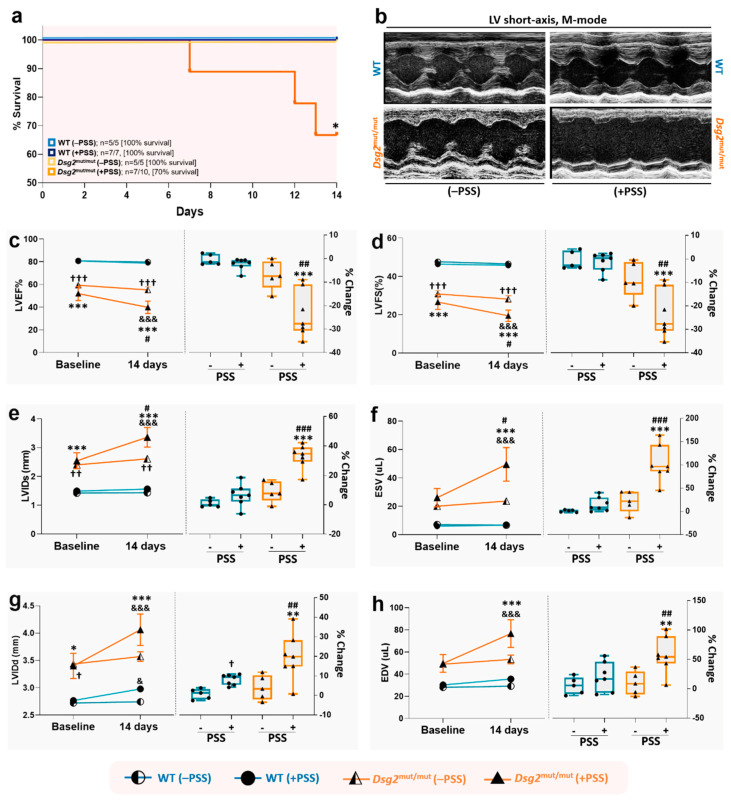
Figure 4.
Psychosocial stress increases the risk of sudden death and worsens cardiac function in Dsg2mut/mut mice. (a) Percent (%) survival curve in non-stressed (–PSS) and stress-induced (+PSS) WT and Dsg2mut/mut mice. PSS, psychosocial stress. Data presented as % survival and n-values inset; * p < 0.05 for Dsg2mut/mut (+PSS) vs. all cohorts via Wilcoxon survival test. (b) Representative left ventricular (LV) short-axis, m-mode echocardiography. Images representative of n = 5–7 mice/cohort. For c–h, the trend of echocardiographic parameters (y-axis) over time (x-axis) is shown on the left panels; and the percent changes (% Change) from baseline to the end of the protocol for each cohort, is shown on the right panels. (c) Percent Left Ventricular Ejection Fraction (LVEF%); (d) Percent Left Ventricular Fractional Shortening (LVFS%); (e) Left Ventricle Internal Diameter at systole (LVIDs; mm); (f) End Systolic Volume (ESV; µL); (g) Left Ventricle Internal Diameter at diastole (LVIDd; mm); and (h) End Diastolic Volume (EDV; µL). Data in left panels are presented as mean ± SEM; n = 5–7 mice/cohort/parameter; & p < 0.05; &&& p < 0.001 any cohort (at 14 days) vs. same cohort (at baseline) within cohort study, using two-way ANOVA with Sidak’s multiple comparisons post-hoc analysis; and * p < 0.01, *** p < 0.001 Dsg2mut/mut (+PSS) vs. WT (+PSS) and WT (−PSS); # p < 0.05 Dsg2mut/mut (+PSS) vs. Dsg2mut/mut (−PSS), † p < 0.05, †† p < 0.01, ††† p < 0.001 Dsg2mut/mut (−PSS) vs. WT (+PSS) and WT (−PSS), between cohort study, using two-way ANOVA with Tukey’s posthoc analysis. Data in right panels presented as box-whisker plots, n = 5–7 mice/cohort/parameter; ** p < 0.01, *** p < 0.001 Dsg2mut/mut (+PSS) vs. WT (+PSS) and WT (−PSS); † p < 0.05 WT (+PSS) vs. WT (−PSS); ## p < 0.01, ### p < 0.001 Dsg2mut/mut (+PSS) vs. Dsg2mut/mut (−PSS), using one-way ANOVA with Tukey’s post-hoc analysis.

