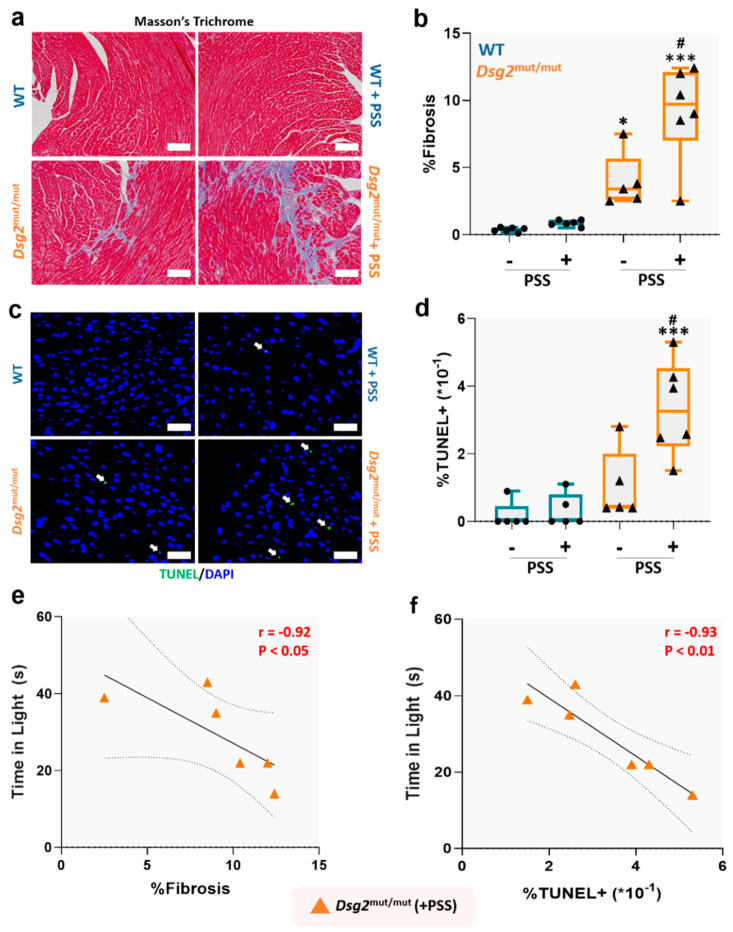
Figure 6.
Psychosocial stress worsens pathological progression in Dsg2mut/mut mice. (a) Representative images of Masson’s Trichrome immunostained myocardium. White scale bars, 100 µm. Images are representative of n = 5–6 mice/cohort; (b) Percent (%) myocardial fibrosis; (c) Representative images of myocardium immunostained for TUNEL and DAPI. Images are representative of n = 5–6 mice/cohort. White arrows, TUNEL positive (+) nuclei; white scale bars, 25 µm. (d) Percent (%) TUNEL+ nuclei in 5 microscopic fields from each mouse/cohort. For (b,c) data presented as box-whisker plots, n = 5–6 mice/cohort. PSS, psychosocial stress. * p < 0.05, *** p < 0.001 vs. WT (+PSS) and WT (−PSS); # p < 0.01 Dsg2mut/mut (+PSS) vs. Dsg2mut/mut (−PSS); using One-Way ANOVA and Tukey’s post-hoc analysis. For (b,d), black dots are WT mice (with or without PSS) and black triangles are Dsg2mut/mut mice (with or without PSS). (e,f) Anxiety levels induced by PSS correlates with cardiac remodeling in Dsg2mut/mut mice. Correlation between time spent in light and (e) percent (%) fibrosis and (f) percent (%) TUNEL+ nuclei in Dsg2mut/mut (+PSS) mice. Data displayed as scatterplots; thick black lines show the best linear fit through data; dotted lines represent two-tailed 95% confidence interval; text inset reports Spearman’s Rho values and associated p-values.

