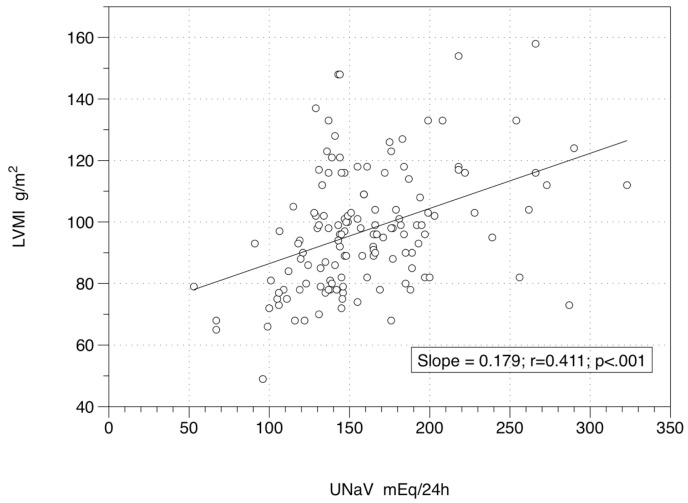
Figure 1.
Relationship between left ventricular mass index and 24-h sodium excretion at baseline. Figure 1 Legend: 138 patients under active drug treatment at Time 0, when a low-sodium diet was administered. Equation of the regression line is y = 68.53 + 0.18x. UNaV: 24-h urinary sodium (excretion); LVMI: left ventricular mass index.

