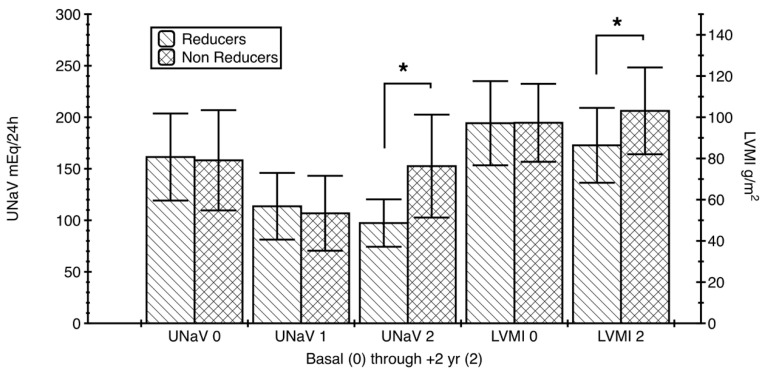
Figure 3.
Left ventricular mass index and 24-h sodium excretion modifications in the two groups of patients. Figure 3 Legend: Reducers (n = 76) had a significant LVMI decrease (two-tailed Student’s t test p < 0.001), while Non-Reducers (n = 62) had a significant increase (two-tailed Student’s t test p < 0.001) of their LVMI over the observation period (2 years). All this was paralleled by the changes of the 24-h sodium excretion. The differences between the groups were significant for LVMI and UNaV at Time 2 (1-way ANOVA, Kruskal-Wallis followed by Dunn’s multiple comparison test: both * p < 0.05). UNaV: 24-h urinary sodium (excretion); LVMI: left ventricular mass index.

